Open Access
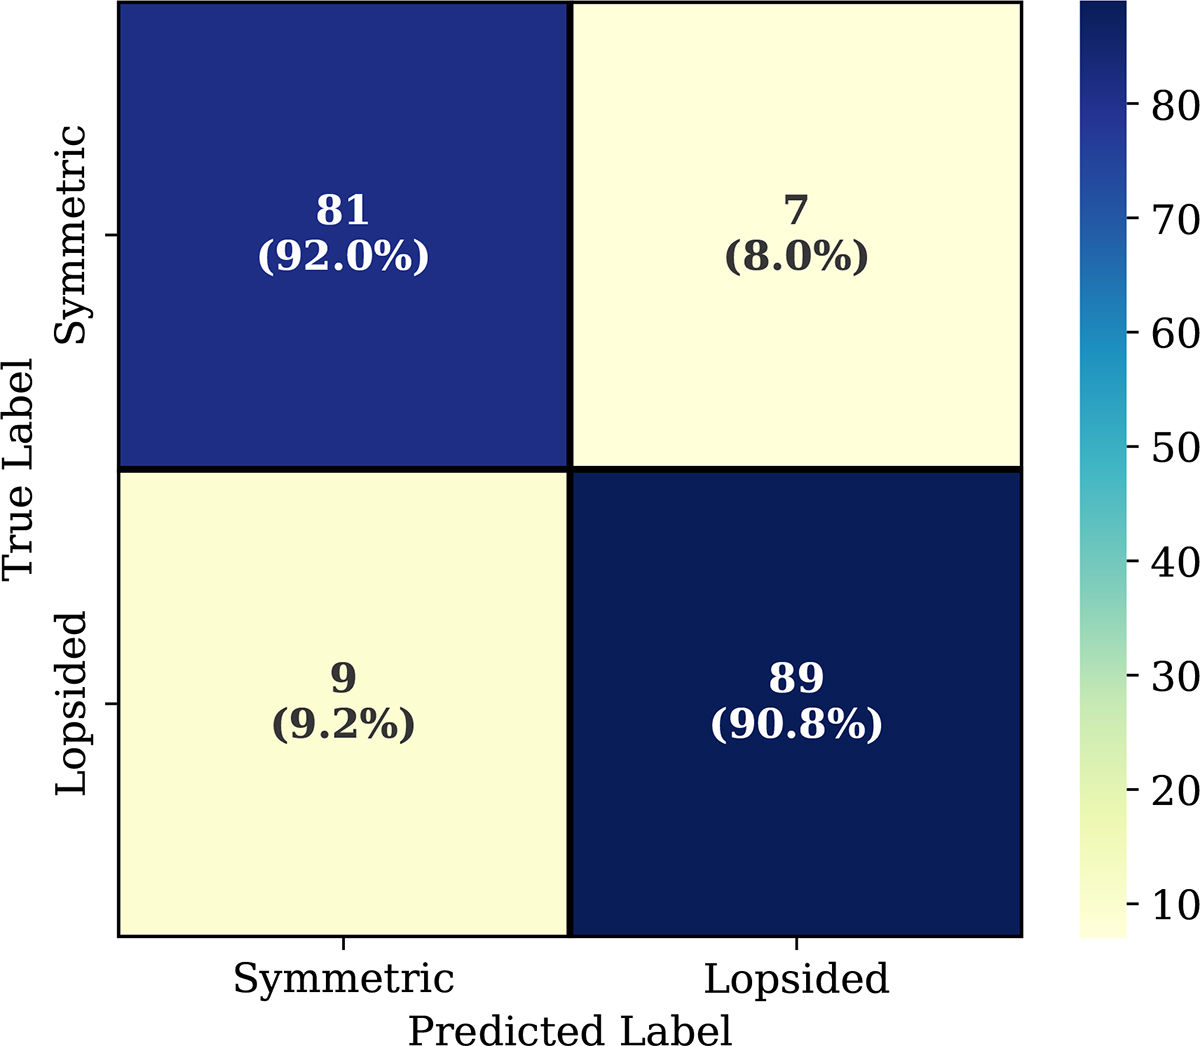
Fig. 5.
Download original image
Confusion matrix representing the correctly predicted and falsely predicted sample in the test set, evaluated using the best-performing model (with the greatest testing AUC score).
Current usage metrics show cumulative count of Article Views (full-text article views including HTML views, PDF and ePub downloads, according to the available data) and Abstracts Views on Vision4Press platform.
Data correspond to usage on the plateform after 2015. The current usage metrics is available 48-96 hours after online publication and is updated daily on week days.
Initial download of the metrics may take a while.