Fig. 6.
Download original image
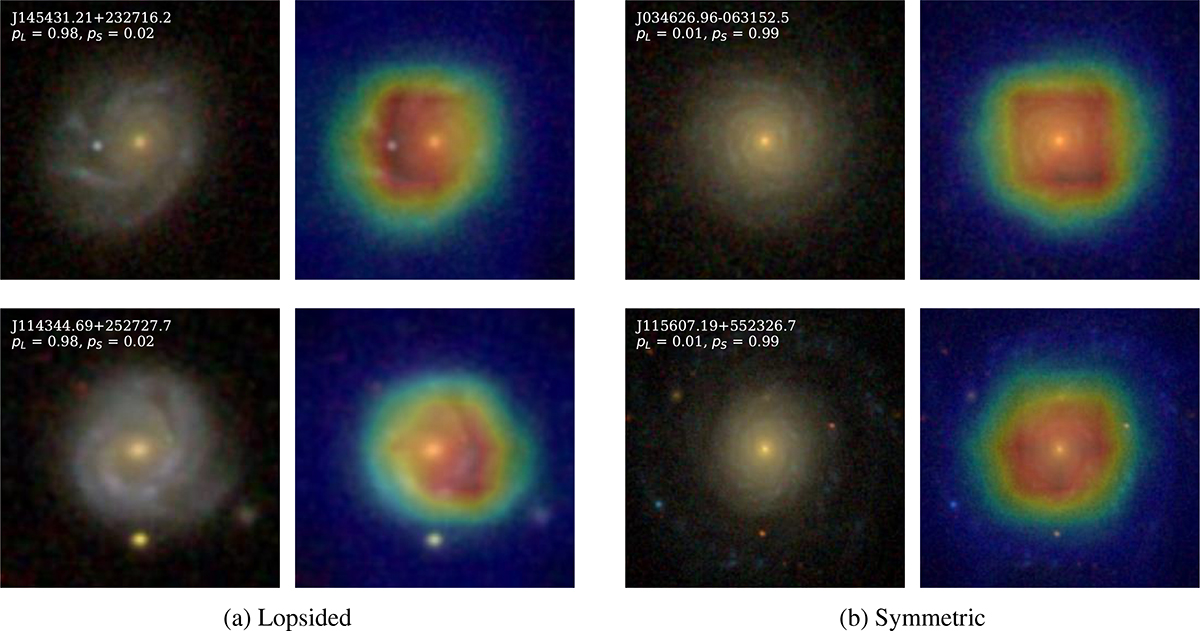
Original images from the test set and the corresponding heat map from the Grad-CAM analysis. The analysis uses the feature maps from the final convolutional layer (just before the global pooling) of the best-performing model to reveal which spatial regions contributed most strongly to the model’s decision-making process (visualised through a heat map where yellow and red regions indicate high importance and blue regions correspond to low importance). The left column shows two correctly predicted lopsided galaxies and the right column presents two correctly predicted symmetric galaxies. In the top-right corner of each image, the probability with which the model would be expected to classify the galaxy as lopsided or symmetric is indicated using the labels pL and pS, respectively.
Current usage metrics show cumulative count of Article Views (full-text article views including HTML views, PDF and ePub downloads, according to the available data) and Abstracts Views on Vision4Press platform.
Data correspond to usage on the plateform after 2015. The current usage metrics is available 48-96 hours after online publication and is updated daily on week days.
Initial download of the metrics may take a while.