Open Access
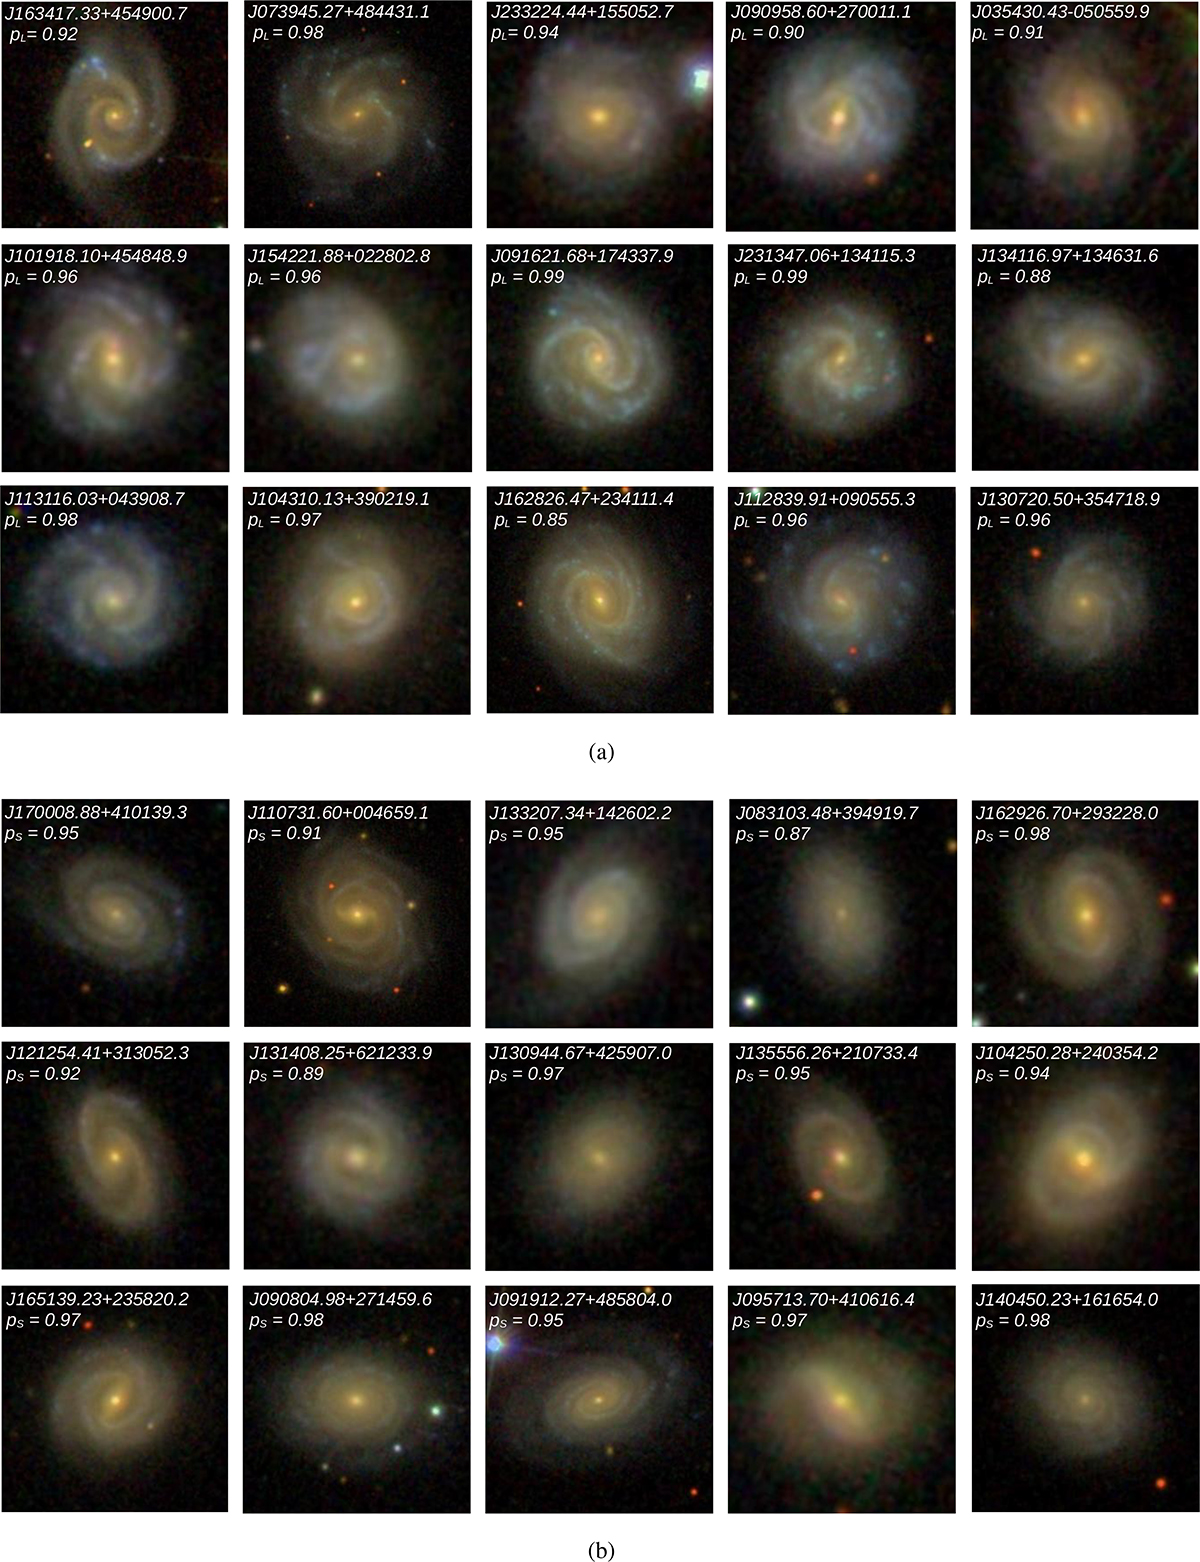
Fig. 8.
Download original image
Sub-set of the lopsided (a) and symmetric (b) galaxies predicted from SDSS DR18 using the best-performing model. The prediction probability corresponding to the predicted label is shown at the top-right corner of each image.
Current usage metrics show cumulative count of Article Views (full-text article views including HTML views, PDF and ePub downloads, according to the available data) and Abstracts Views on Vision4Press platform.
Data correspond to usage on the plateform after 2015. The current usage metrics is available 48-96 hours after online publication and is updated daily on week days.
Initial download of the metrics may take a while.