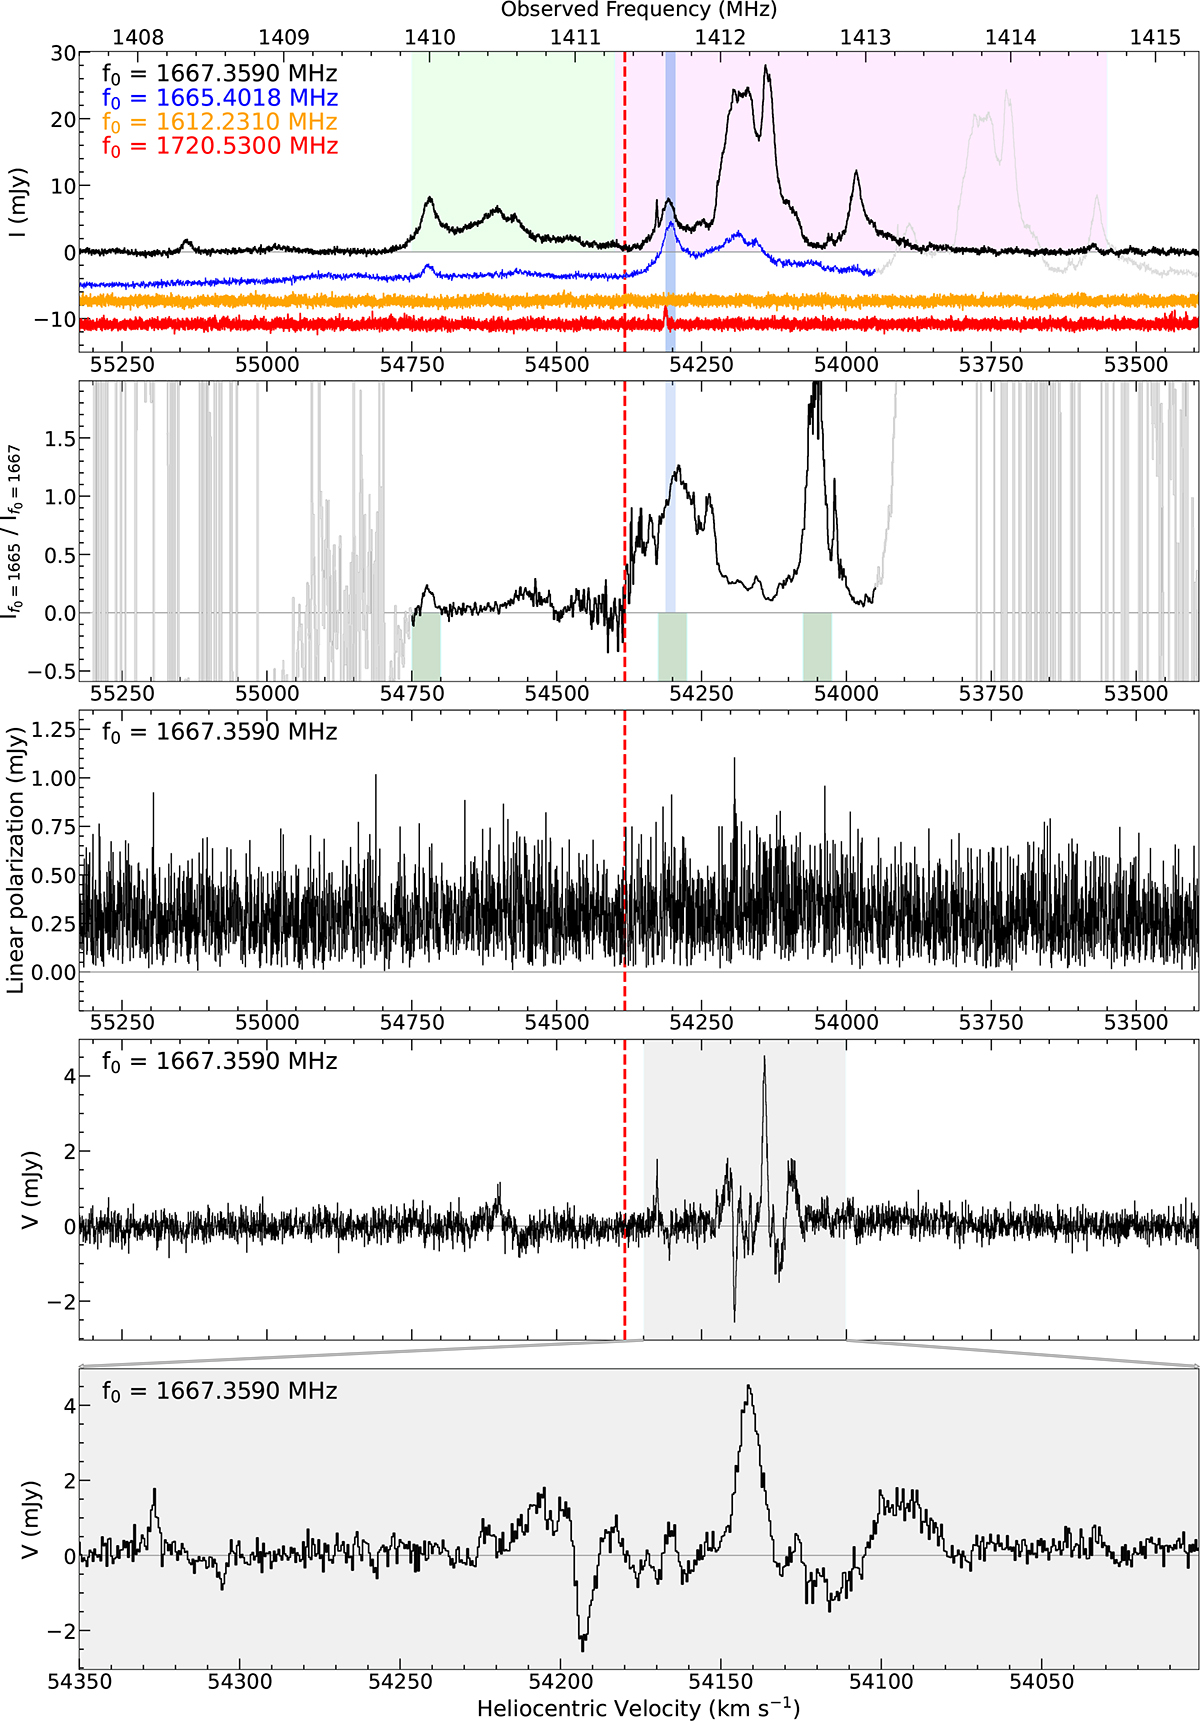
Fig. 5.
Download original image
OH megamaser emissions from IRAS 02524+2046 observed by FAST for 110 minutes. Top panel: Stokes I spectra of the OH ground state aligned by heliocentric velocity, with given vertical offsets for clarity. The dashed vertical line marks the heliocentric velocity vhelio = cz = 54 382 km s−1 of IRAS 02524+2046 for a redshift z = 0.1814 from optical spectrophotometry (Darling & Giovanelli 2006). The thick light blue line highlights the pair of 1667 and 1665 MHz OH megamaser lines, showing an unusual flux ratio reported by Darling & Giovanelli (2002a) and McBride et al. (2013). The fuchsia shaded area indicates the probable velocity range of the 1667 MHz OH megamaser emission lines, while the lime shaded area represents the velocity range in which the 1665 and 1667 MHz lines are likely mixed (see Sect. 4.1). Upper middle panel: Intensity ratio of the 1665 MHz to 1667 MHz lines. The dark green shaded areas indicate that the intensity ratio of the 1665 MHz to 1667 MHz transitions is potentially overestimated near vhelio ∼ 54 050 km s−1 and vhelio ∼ 54 300 km s−1, and underestimated near vhelio ∼ 54 725 km s−1. Middle panel: Linear polarization spectrum at the heliocentric velocity for 1667.3590 MHz line. Lower middle panel: Stokes V spectrum at the heliocentric velocity for 1667.3590 MHz line, showing some features from the 1665.4018 MHz transition. Bottom panel: Zoomed-in view of the Stokes V spectral features.
Current usage metrics show cumulative count of Article Views (full-text article views including HTML views, PDF and ePub downloads, according to the available data) and Abstracts Views on Vision4Press platform.
Data correspond to usage on the plateform after 2015. The current usage metrics is available 48-96 hours after online publication and is updated daily on week days.
Initial download of the metrics may take a while.