Fig. 14.
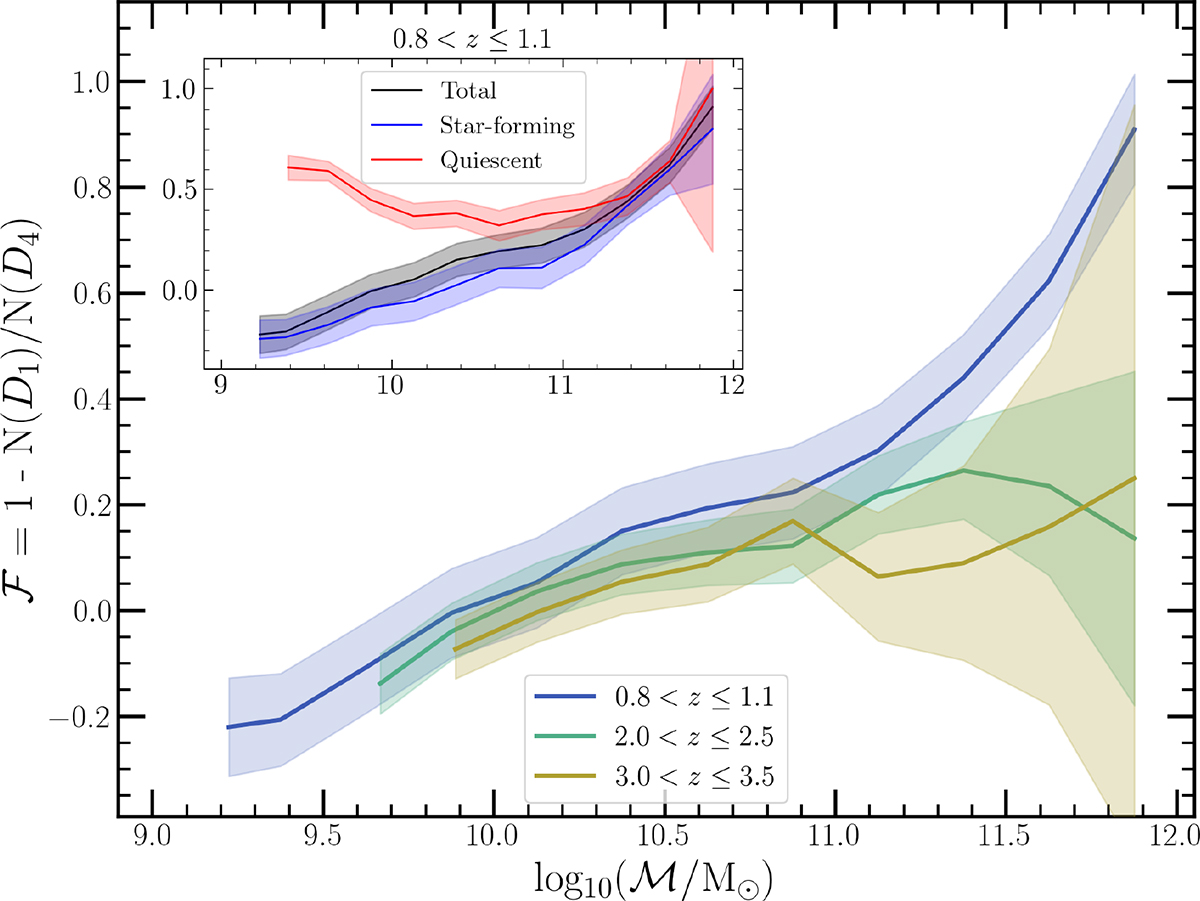
Download original image
Fraction of all galaxies in each ℳ bin in the most dense environments, D4, compared to the least dense environments, D1, relative to unity, ℱ = 1 − N(D1)/N(D4). See the main text for a description of the density estimates. For ℱ < 0, more galaxies are contributed by the least-dense environments; ℱ = 0 implies the two quartiles contribute equally; and ℱ > 0 indicates that more galaxies are contributed by the most dense environments. The solid coloured lines indicates the ratio of the counts in each quartile (subtracted from 1), and the shaded regions correspond to the 1σ uncertainties propagated from σΦ (Sect. 3.4). At low masses (ℳ < 1010 M⊙), more galaxies are found in low-density environments, while galaxies above are preferentially located in high-density environments. The inset plot shows the same relationship for 0.8 < z ≤ 1 separated into star-forming and quiescent galaxies. The over-abundance of low-mass quiescent galaxies in high-density environments is indicative of ‘environment quenching’ (Peng et al. 2010, 2012).
Current usage metrics show cumulative count of Article Views (full-text article views including HTML views, PDF and ePub downloads, according to the available data) and Abstracts Views on Vision4Press platform.
Data correspond to usage on the plateform after 2015. The current usage metrics is available 48-96 hours after online publication and is updated daily on week days.
Initial download of the metrics may take a while.