Fig. 2.
Download original image
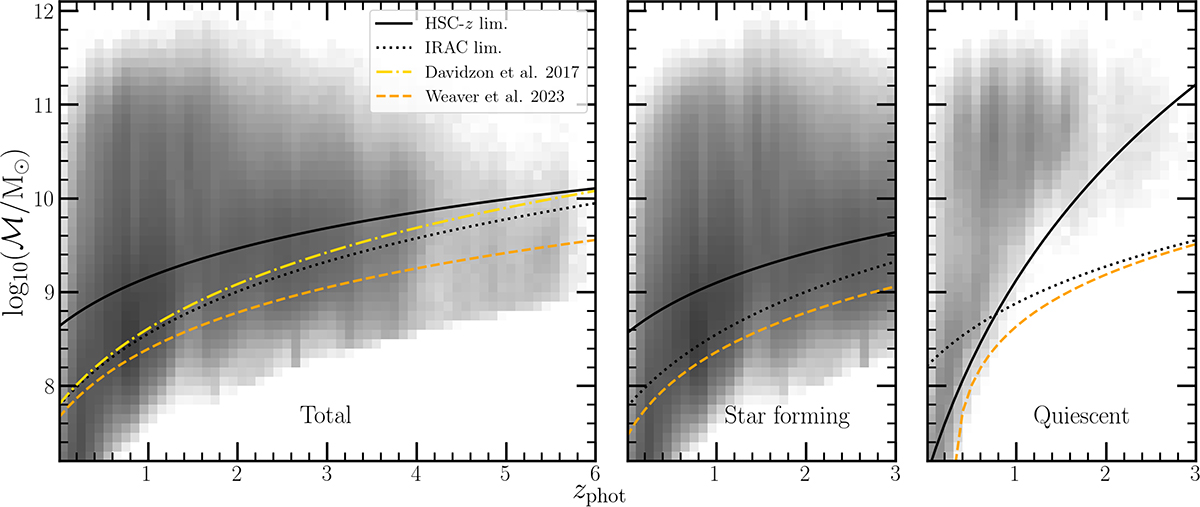
Galaxy stellar mass distribution as a function of redshift. The limiting stellar mass of the total (left), star-forming (middle), and quiescent (right) samples are determined as a function of redshift following Pozzetti et al. (2010) and are shown by the solid black curves. Two estimates are computed based on the limiting magnitude of HSC z (solid) and the IRAC [3.6 μm] limiting magnitude (dotted), respectively. The more conservative estimate using HSC z is used in the remainder of this work and are presented as Eqs. (3)–(5) for the total, star-forming, and quiescent samples. For comparison, the stellar mass limits of D17 and W23 are also shown. Shading corresponds to logarithmic density.
Current usage metrics show cumulative count of Article Views (full-text article views including HTML views, PDF and ePub downloads, according to the available data) and Abstracts Views on Vision4Press platform.
Data correspond to usage on the plateform after 2015. The current usage metrics is available 48-96 hours after online publication and is updated daily on week days.
Initial download of the metrics may take a while.