Open Access
Fig. 4.
Download original image
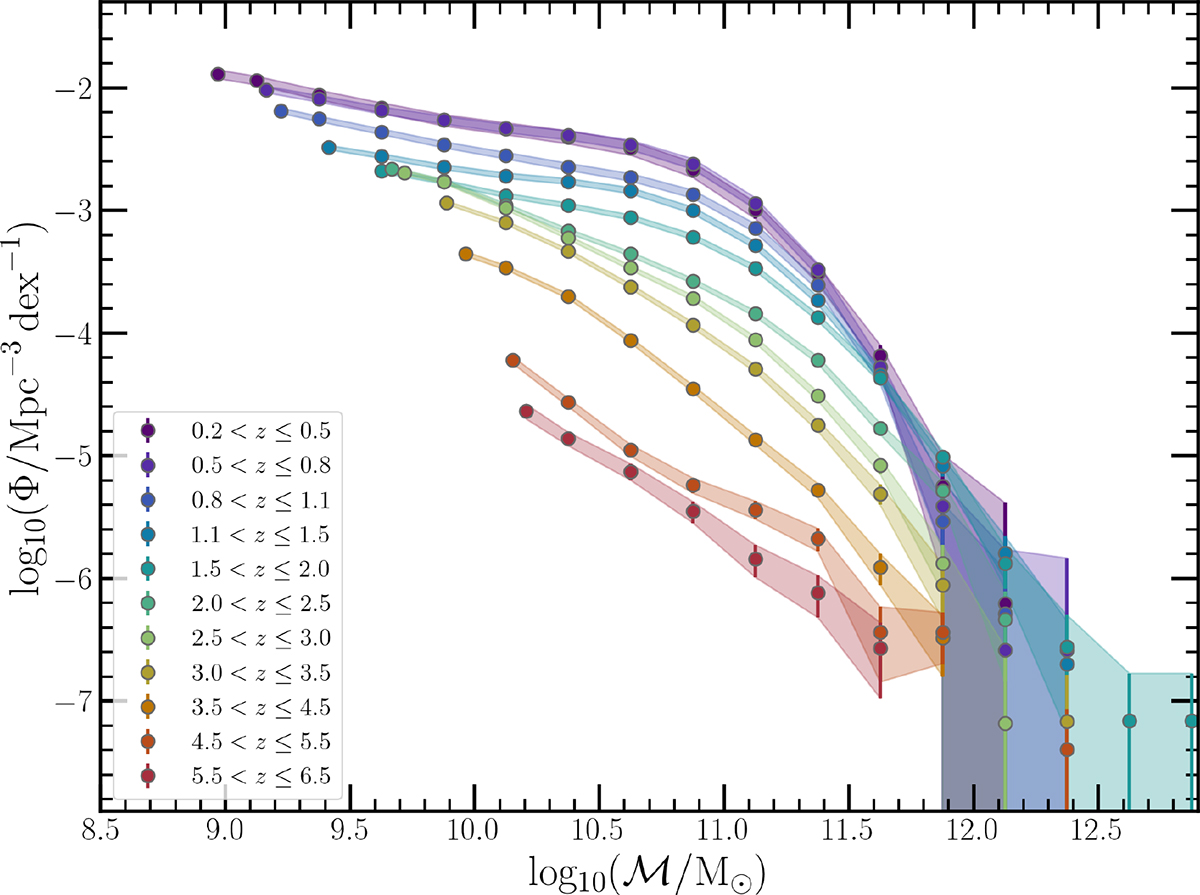
Evolution of the observed galaxy SMF of the total sample across 0.2 < z ≤ 6.5. The ℳ bins are uniform except for the first bin, which is extended to the respective stellar mass limit. The ℳ bins below the stellar mass limit (Eq. 3) are not shown. Uncertainties are indicated by the solid error bars and shaded regions.
Current usage metrics show cumulative count of Article Views (full-text article views including HTML views, PDF and ePub downloads, according to the available data) and Abstracts Views on Vision4Press platform.
Data correspond to usage on the plateform after 2015. The current usage metrics is available 48-96 hours after online publication and is updated daily on week days.
Initial download of the metrics may take a while.