Fig. 9.
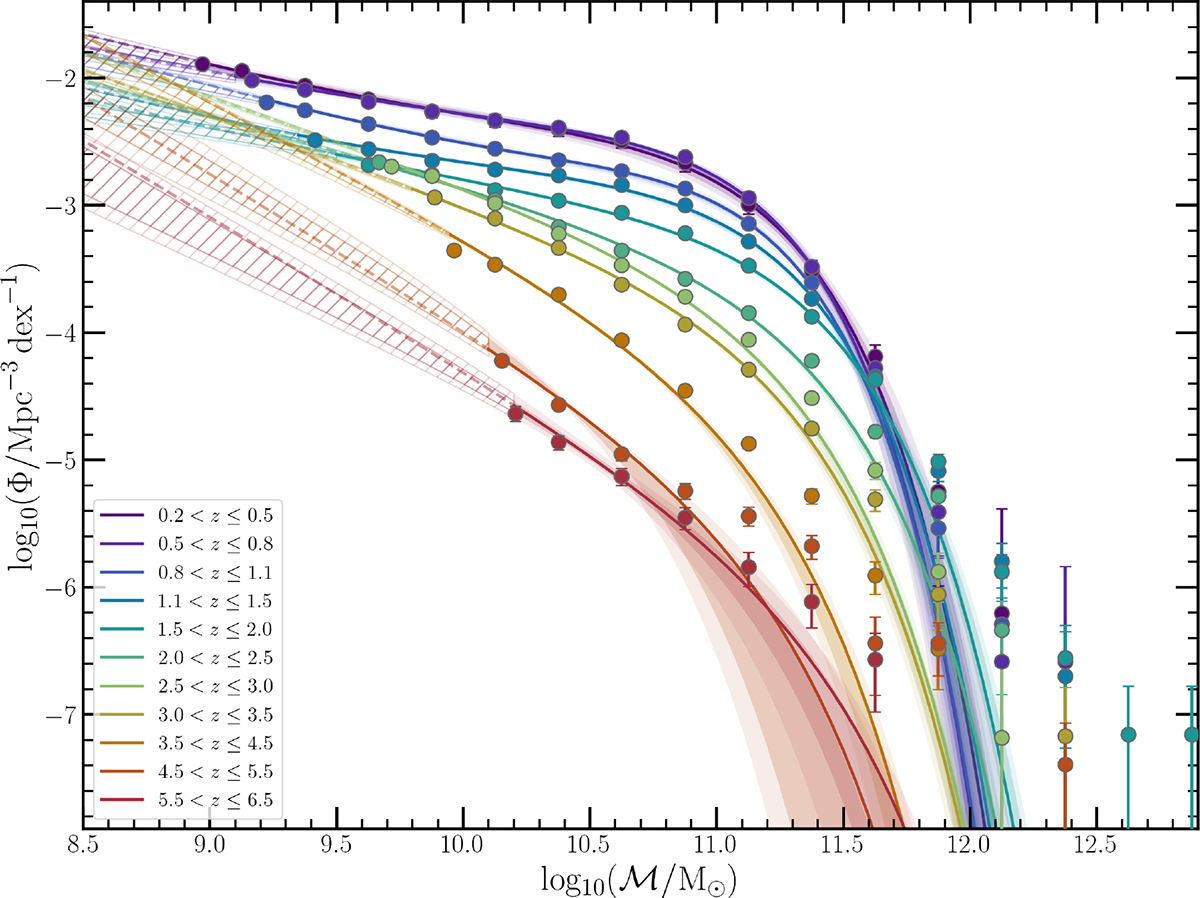
Download original image
Evolution of the intrinsic galaxy SMF of the total sample, shown as solid lines, across 0.2 < z ≤ 6.5. Maximum a posteriori values are assumed, as listed in Table A.1. The 1σ (2σ) uncertainty according to the variation in the MCMC chains is shown by the dark (light) shaded regions. Extrapolations below the stellar mass limit (Eq. (3)) are shown by the dashed lines, and the uncertainties are indicated by the hatched regions. Observed values for corresponding redshift bins are shown in the matching colour as data points with error bars.
Current usage metrics show cumulative count of Article Views (full-text article views including HTML views, PDF and ePub downloads, according to the available data) and Abstracts Views on Vision4Press platform.
Data correspond to usage on the plateform after 2015. The current usage metrics is available 48-96 hours after online publication and is updated daily on week days.
Initial download of the metrics may take a while.