Fig. 10
Download original image
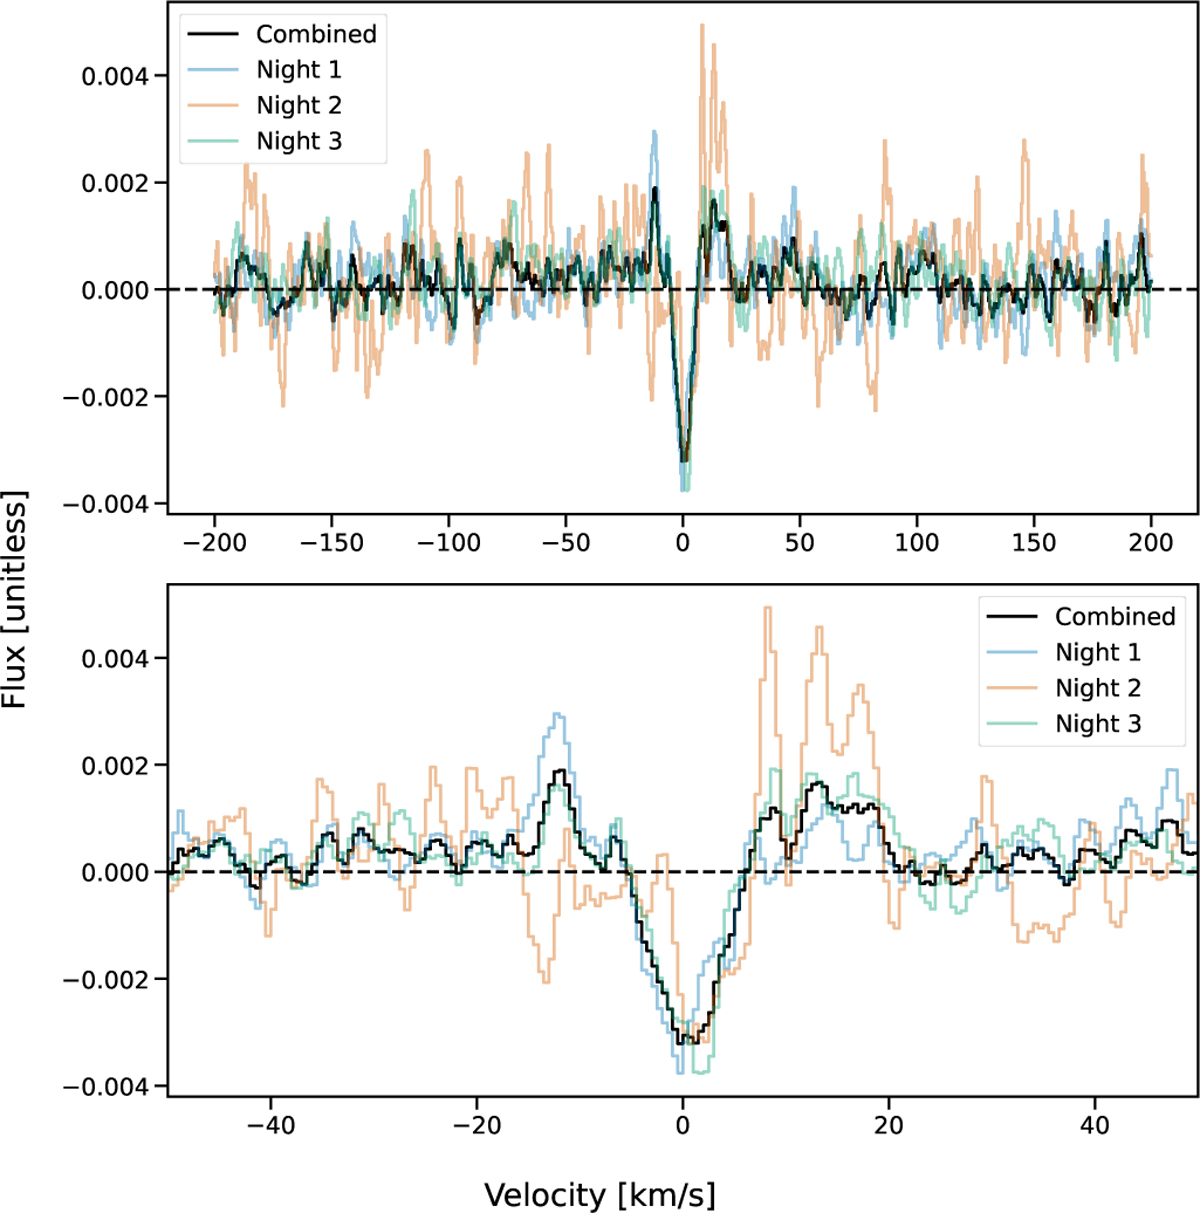
Cross-correlation of iron template with the combined and night-specific transmission spectroscopy in the rest frame of the planet. The combined CCF of all nights is shown in black, with the nights shown separately in blue (night 1), orange (night 2), and green (night 3). The top panel shows the full velocity range over which the CCF was calculated. The bottom panel shows a zoomed-in view of −50,50 km s−1. Absorption is positive with respect to the continuum.
Current usage metrics show cumulative count of Article Views (full-text article views including HTML views, PDF and ePub downloads, according to the available data) and Abstracts Views on Vision4Press platform.
Data correspond to usage on the plateform after 2015. The current usage metrics is available 48-96 hours after online publication and is updated daily on week days.
Initial download of the metrics may take a while.