Fig. 11
Download original image
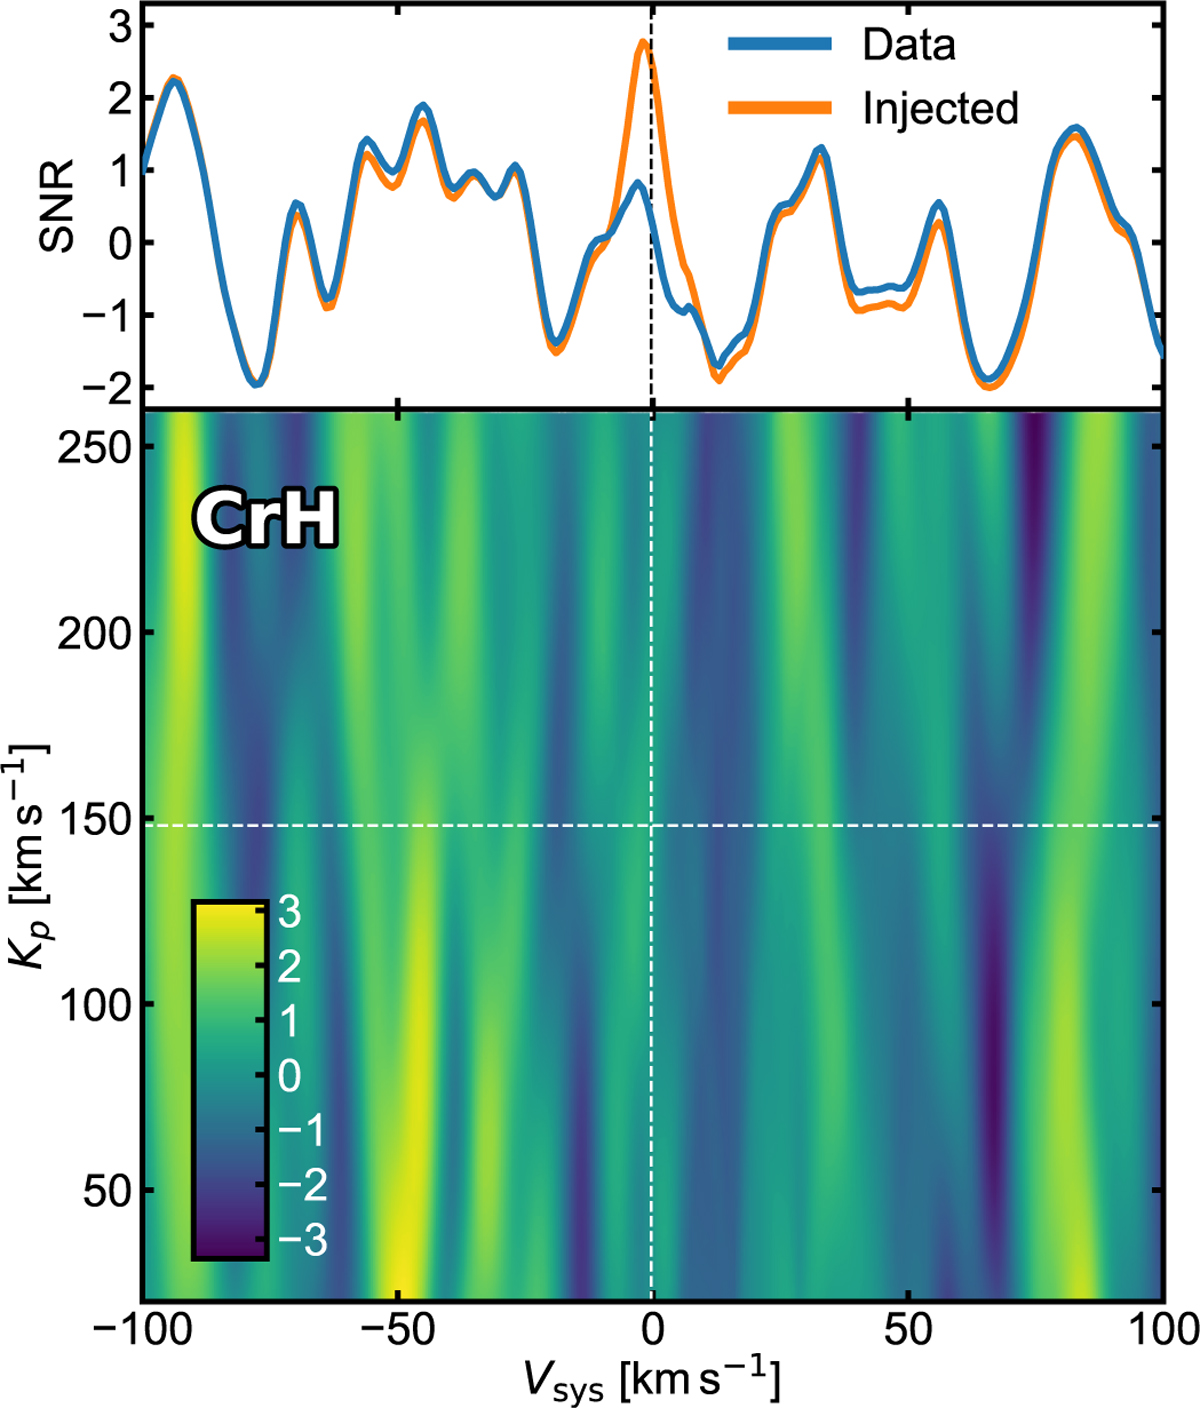
Chromium-hydride (CrH) cross-correlation search and sensitivity check. The bottom panel shows the phase-folded Kp-Vsys signal-to-noise map of the ESPRESSO WASP-31b transit data cross-correlated with a CrH model template. The dashed lines denote the expected values of (Vsys = −0.1 km s−1, and Kp = 148.0 km s−1, Gaia Collaboration 2023; Flagg et al. 2023). The top panel shows a one-dimensional slice at the expected Kp (along the horizontal dashed white line) for both the data alone (blue) and the data with an injected model (orange). The difference between the blue and orange lines is a measure of the data sensitivity to an underlying signal. In this case, these data only have limited sensitivity to CrH, which has its strongest opacity band heads redward of the ESPRESSO wavelength coverage. Although no clear CrH signal is observed in the data here, we cannot conclusively confirm or rule out its presence in the atmosphere of WASP-31b due to limited sensitivity.
Current usage metrics show cumulative count of Article Views (full-text article views including HTML views, PDF and ePub downloads, according to the available data) and Abstracts Views on Vision4Press platform.
Data correspond to usage on the plateform after 2015. The current usage metrics is available 48-96 hours after online publication and is updated daily on week days.
Initial download of the metrics may take a while.