Fig. A.1
Download original image
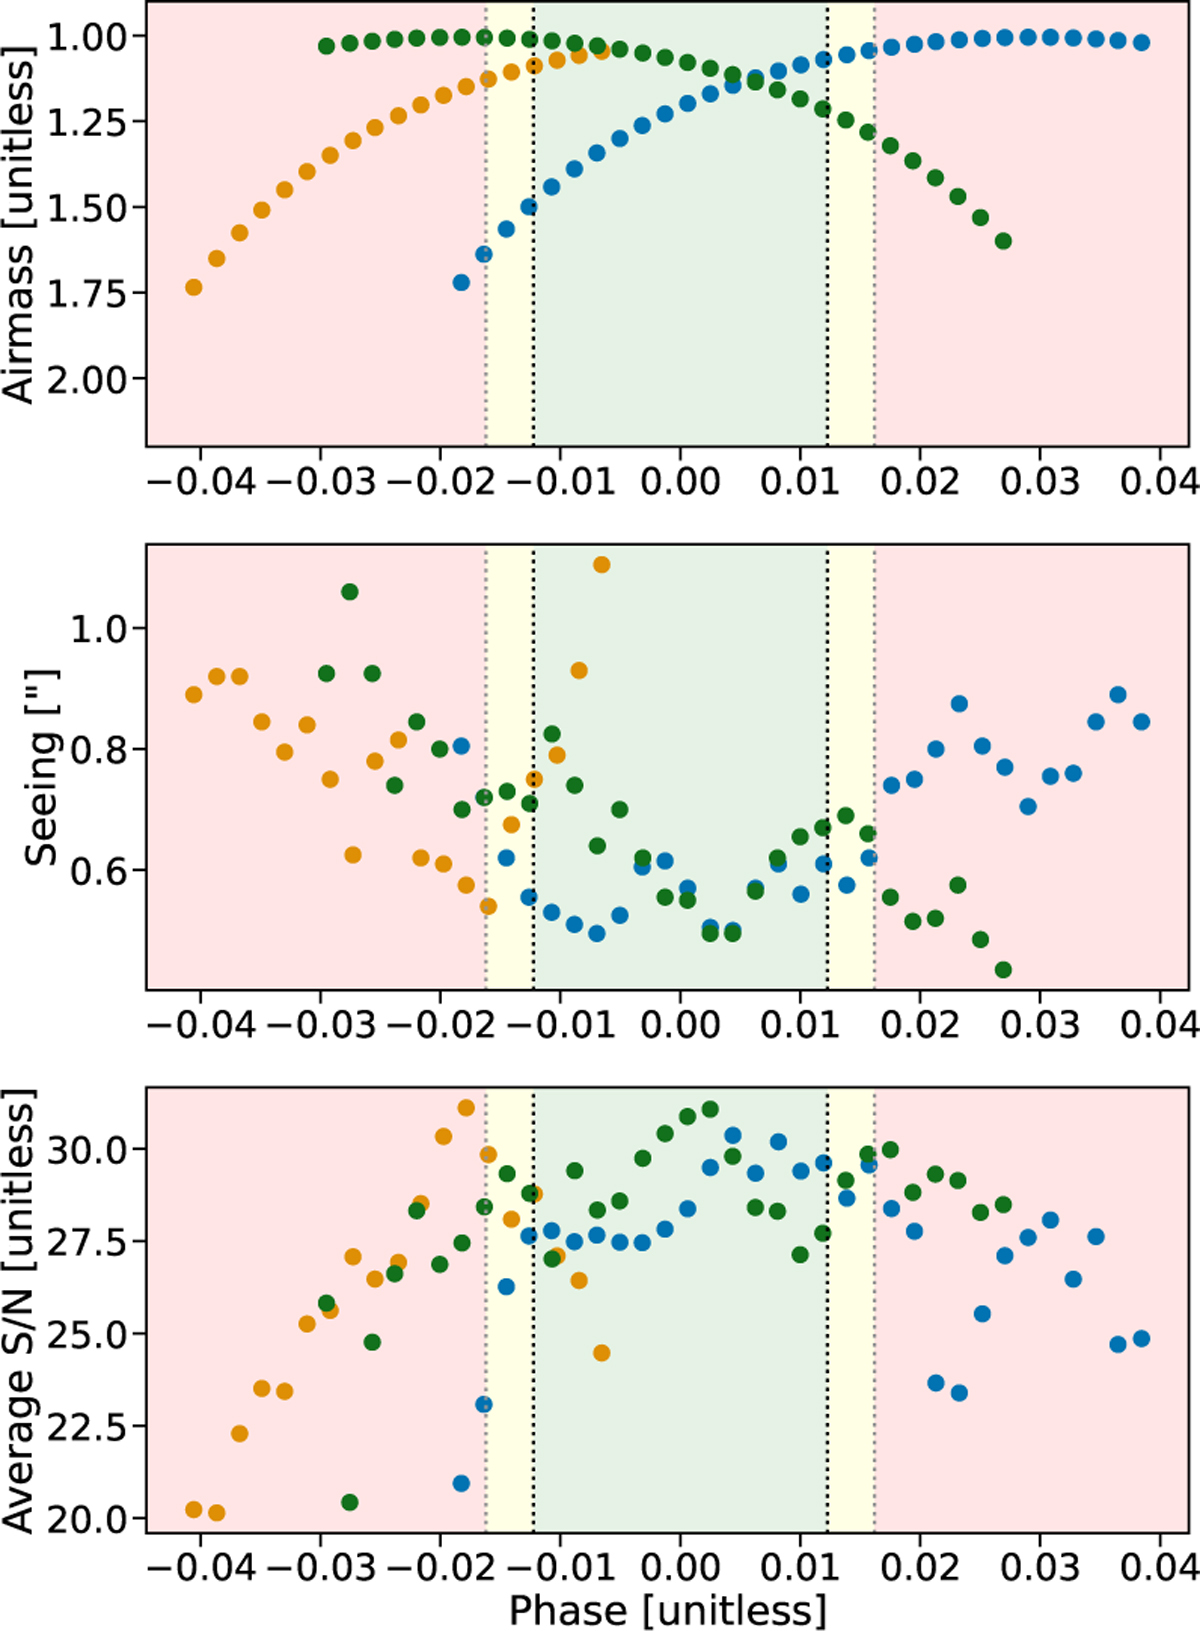
Observation log of the three nights ESPRESSO observation. The red, yellow and green regions correspond to out-of-transit, partial-transit and full-transit phases, with the transit contact points plotted as gray (T1, T4) or black (T2, T3) dotted lines. The blue, orange and green points corresponds to first, second and third night, respectively. Top panel is showing the Airmass variation for each night in the phase space. Middle panel is the same plot but for seeing variation, and bottom panel is the average S/N during the observations. The quality of nights is comparable for the ESPRESSO nights. During the second night (orange points) of ESPRESSO, the seeing condition got worse mid-transit, which led to stopping the observation.
Current usage metrics show cumulative count of Article Views (full-text article views including HTML views, PDF and ePub downloads, according to the available data) and Abstracts Views on Vision4Press platform.
Data correspond to usage on the plateform after 2015. The current usage metrics is available 48-96 hours after online publication and is updated daily on week days.
Initial download of the metrics may take a while.