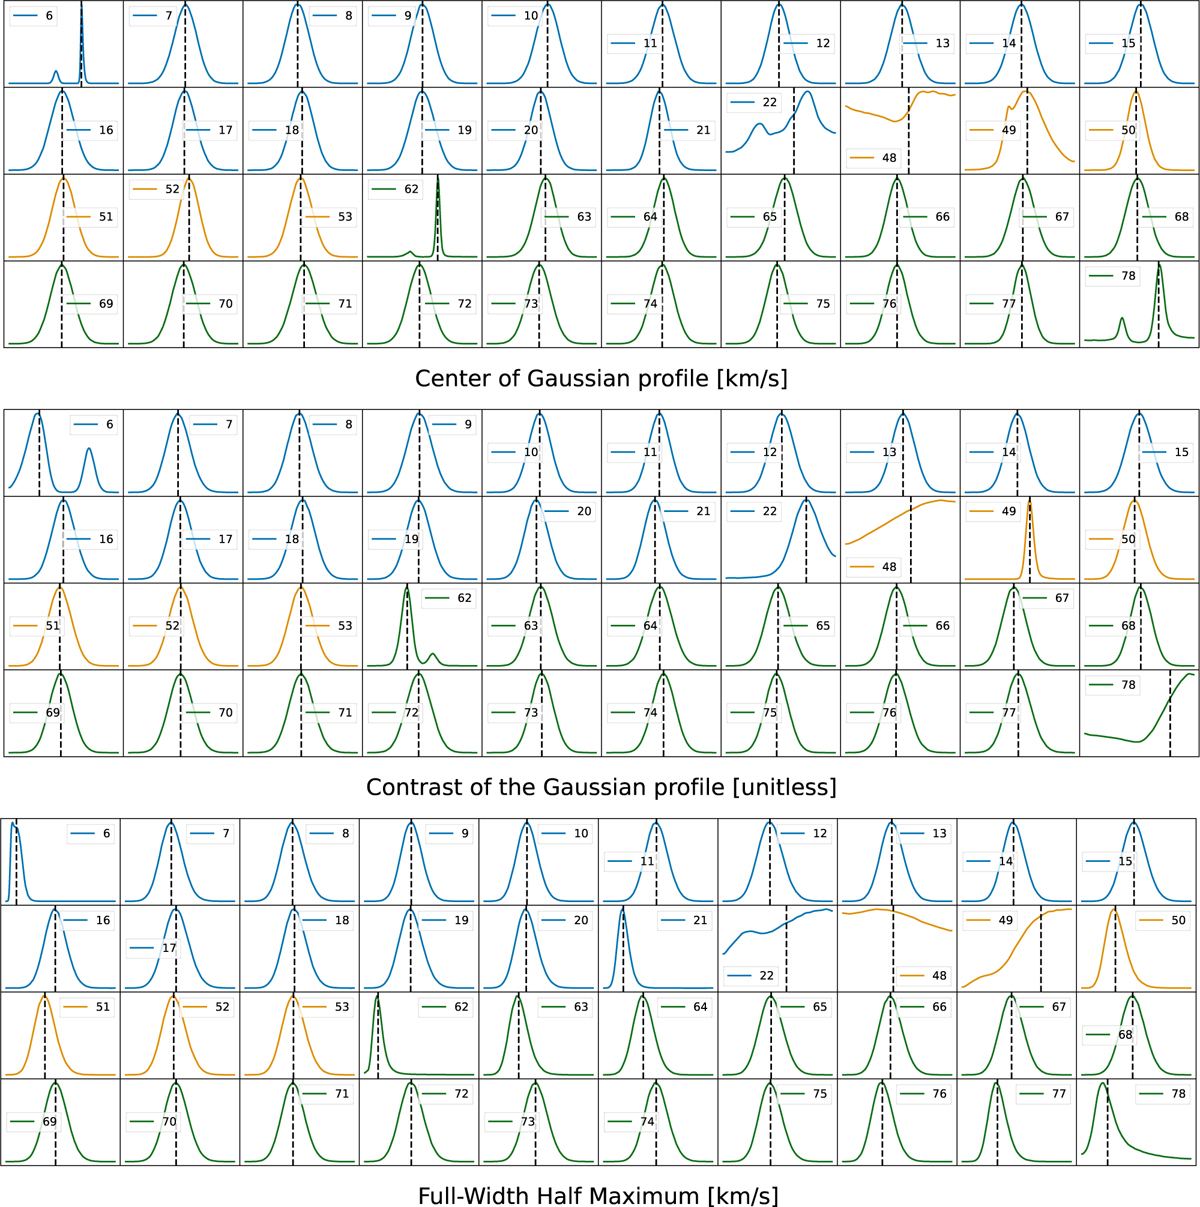
Fig. C.1
Download original image
Posteriors distribution of the analysis of intrinsic CCF’s. The top panel shows the center of the Gaussian, the middle panel is the amplitude (contrast) of the Gaussian and the bottom panel is the FWHM. The distributions are color-coded by night (blue for #1, orange for #2 and green for #3). The label corresponds to a specific index assigned to each spectrum at the start of the pipeline, after the spectrum list has been sorted by time (meaning these are phases sorted per night). Only in-transit data are shown (between T1 and T4 contact points). As we use this plot only for illustration of how well/poorly defined the PDFs are, the x and y-axis ticks were removed. The distributions are well-behaved for all spectra during the full transit, but as expected, the first and last transiting spectrum show poorly defined distributions, and were thus removed from the analysis. Furthermore, the second spectrum in second night (#49) shows poor FWHM distribution, and has also been removed from the analysis.
Current usage metrics show cumulative count of Article Views (full-text article views including HTML views, PDF and ePub downloads, according to the available data) and Abstracts Views on Vision4Press platform.
Data correspond to usage on the plateform after 2015. The current usage metrics is available 48-96 hours after online publication and is updated daily on week days.
Initial download of the metrics may take a while.