Fig. C.2
Download original image
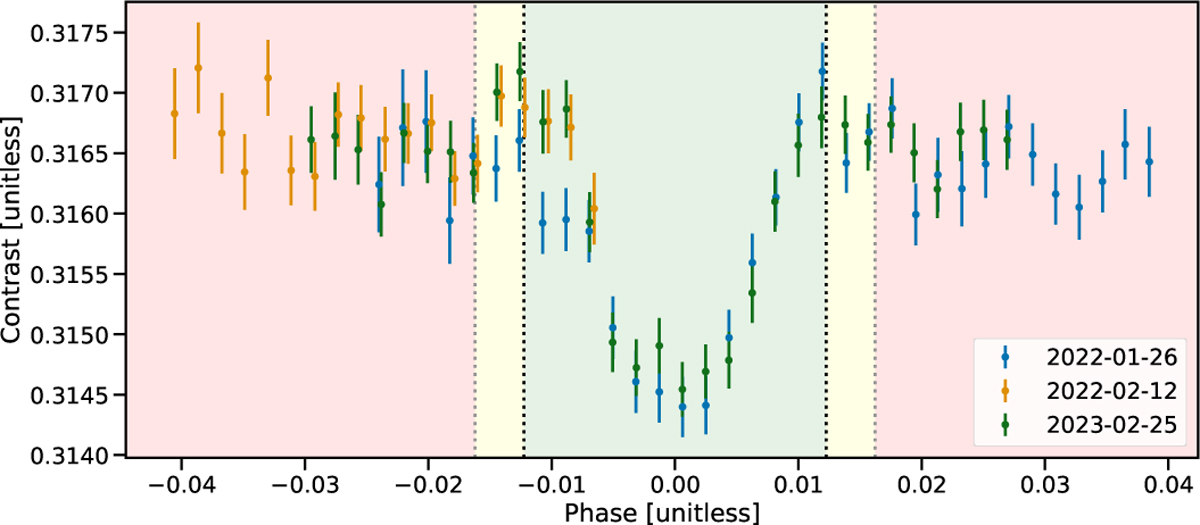
Contrast of the raw CCF, extracted by fitting a Gaussian profile. Each night is color-coded (blue, orange, and green for first, second and third night, respectively). The first few in-transit exposures of the first night are clearly deviating from the trend. The red, yellow and green regions correspond to out-of-transit, partial-transit and full-transit times, with the transit contact points plotted as gray (T1,T4) or black (T2, T3) dotted lines.
Current usage metrics show cumulative count of Article Views (full-text article views including HTML views, PDF and ePub downloads, according to the available data) and Abstracts Views on Vision4Press platform.
Data correspond to usage on the plateform after 2015. The current usage metrics is available 48-96 hours after online publication and is updated daily on week days.
Initial download of the metrics may take a while.