Fig. D.1
Download original image
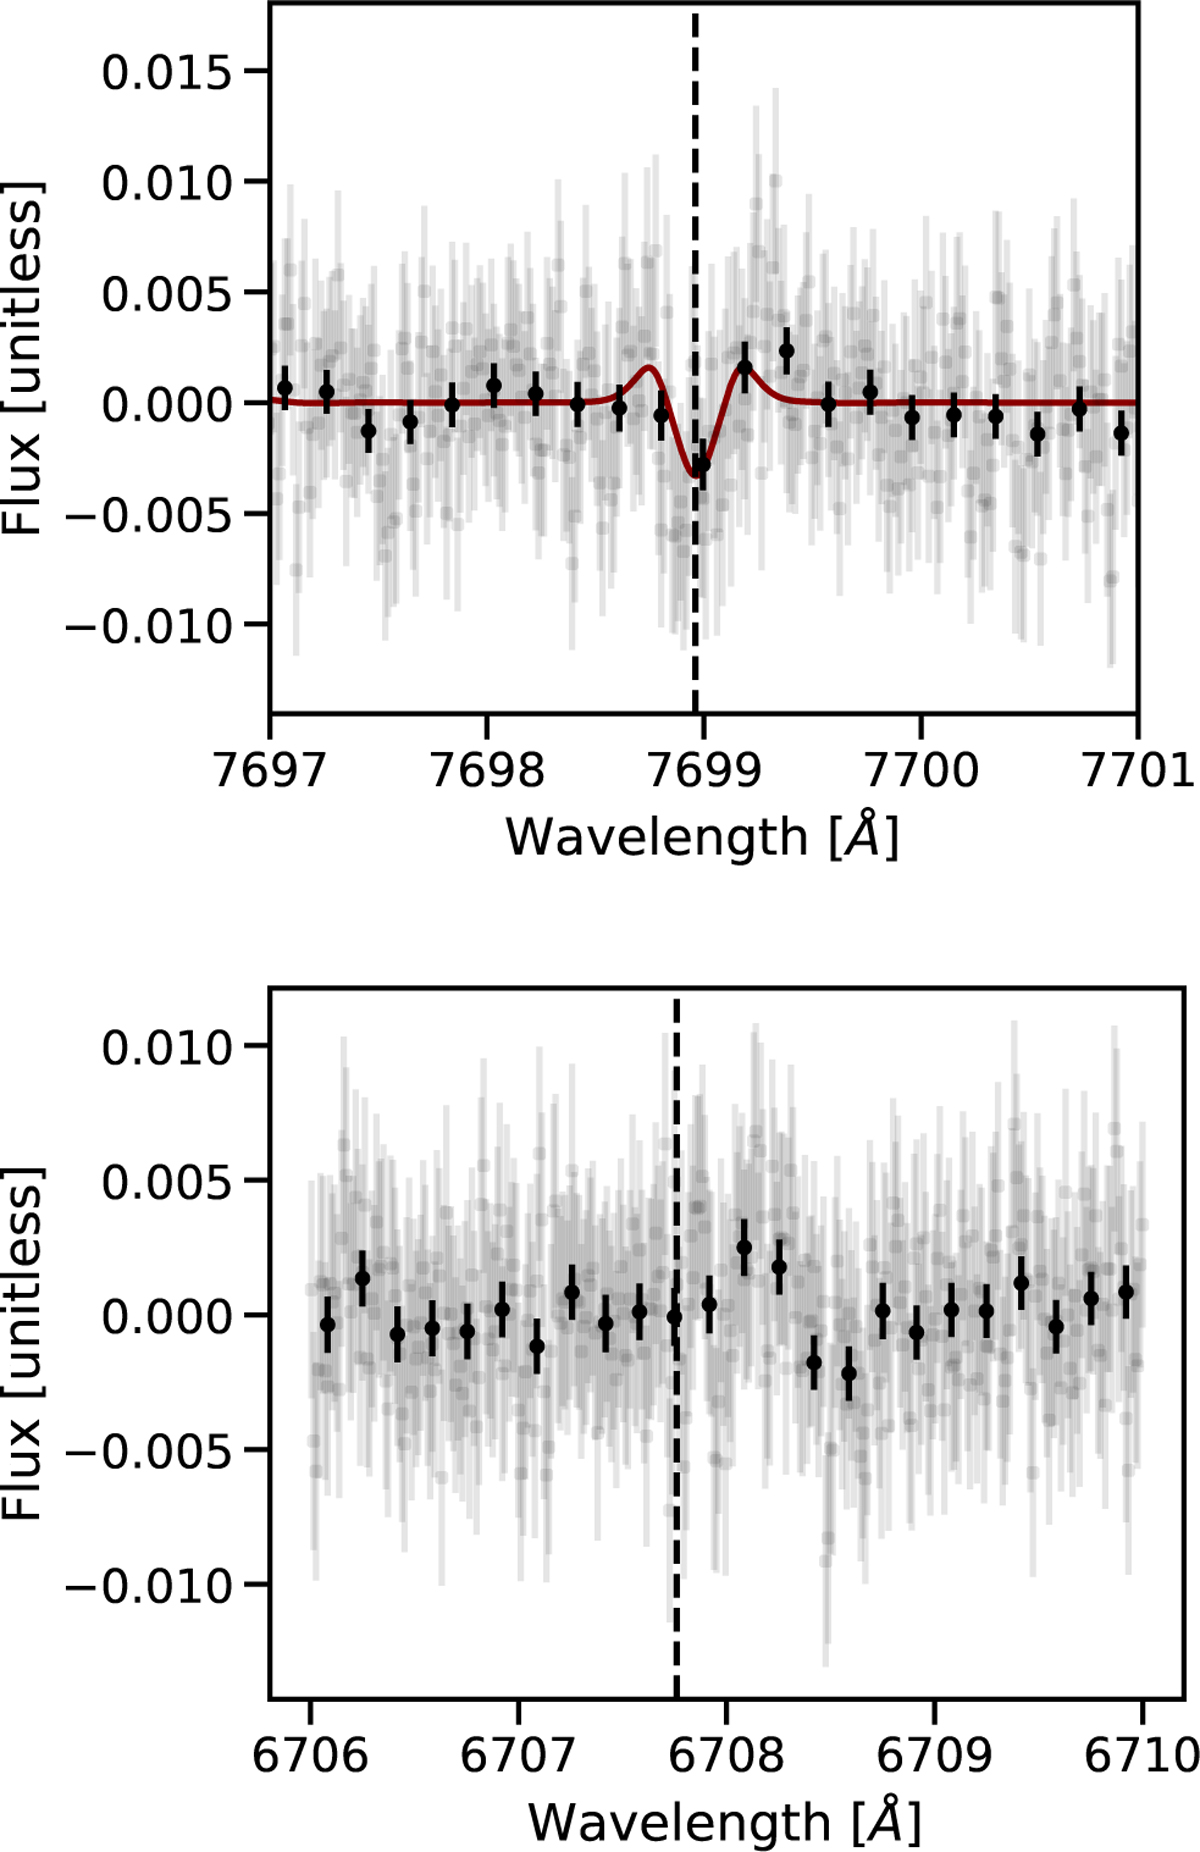
Transmission spectrum of potassium (top) and lithium (bottom). The black dashed line marks the line position; the solid red line shows the no-atmosphere POLD model (top panel only) to illustrate the deformation scale; the red dashed line shows the continuum (bottom panel only). Gray data points indicate the full transmission spectrum, with black bins every 15 pixels. Potassium is contaminated by POLD effects, with no obvious atmospheric detection. Lithium shows no detection, even though it is not contaminated by POLD effects, as this species does not absorb in the stellar spectrum.
Current usage metrics show cumulative count of Article Views (full-text article views including HTML views, PDF and ePub downloads, according to the available data) and Abstracts Views on Vision4Press platform.
Data correspond to usage on the plateform after 2015. The current usage metrics is available 48-96 hours after online publication and is updated daily on week days.
Initial download of the metrics may take a while.