Fig. E.3
Download original image
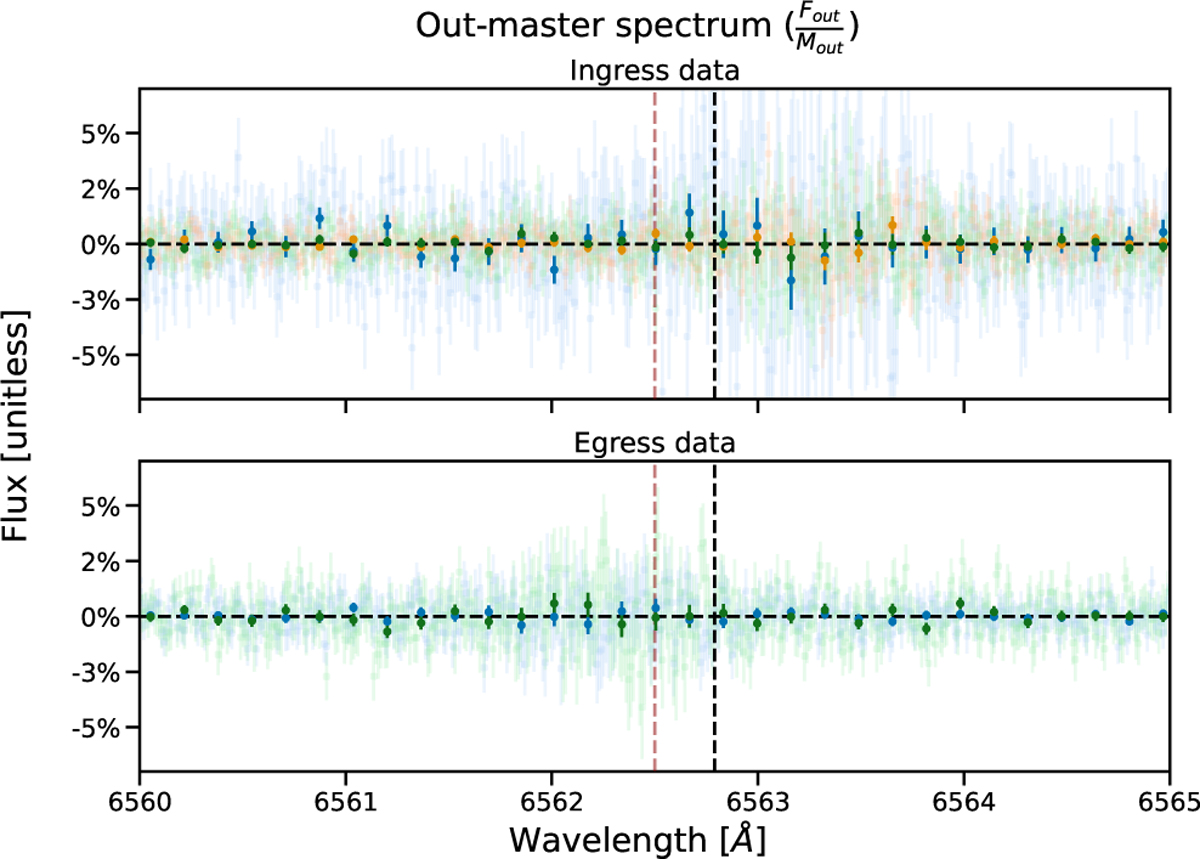
Out of transit spectra in the region of H α per night as calculated for the “Ingress” data (top) and “Egress” data (bottom). Nights are color coded as blue, orange, and green for night #1, #2 and #3 respectively. The vertical black dashed line corresponds to the laboratory wavelength of H α, with the red dashed line positioned at 6562.5Å, the position of the observed absorption feature. The black dashed horizontal line is the continuum level. Note the “Ingress” data for night #1 consists of 3 spectra, which decreases the observed S/N.
Current usage metrics show cumulative count of Article Views (full-text article views including HTML views, PDF and ePub downloads, according to the available data) and Abstracts Views on Vision4Press platform.
Data correspond to usage on the plateform after 2015. The current usage metrics is available 48-96 hours after online publication and is updated daily on week days.
Initial download of the metrics may take a while.