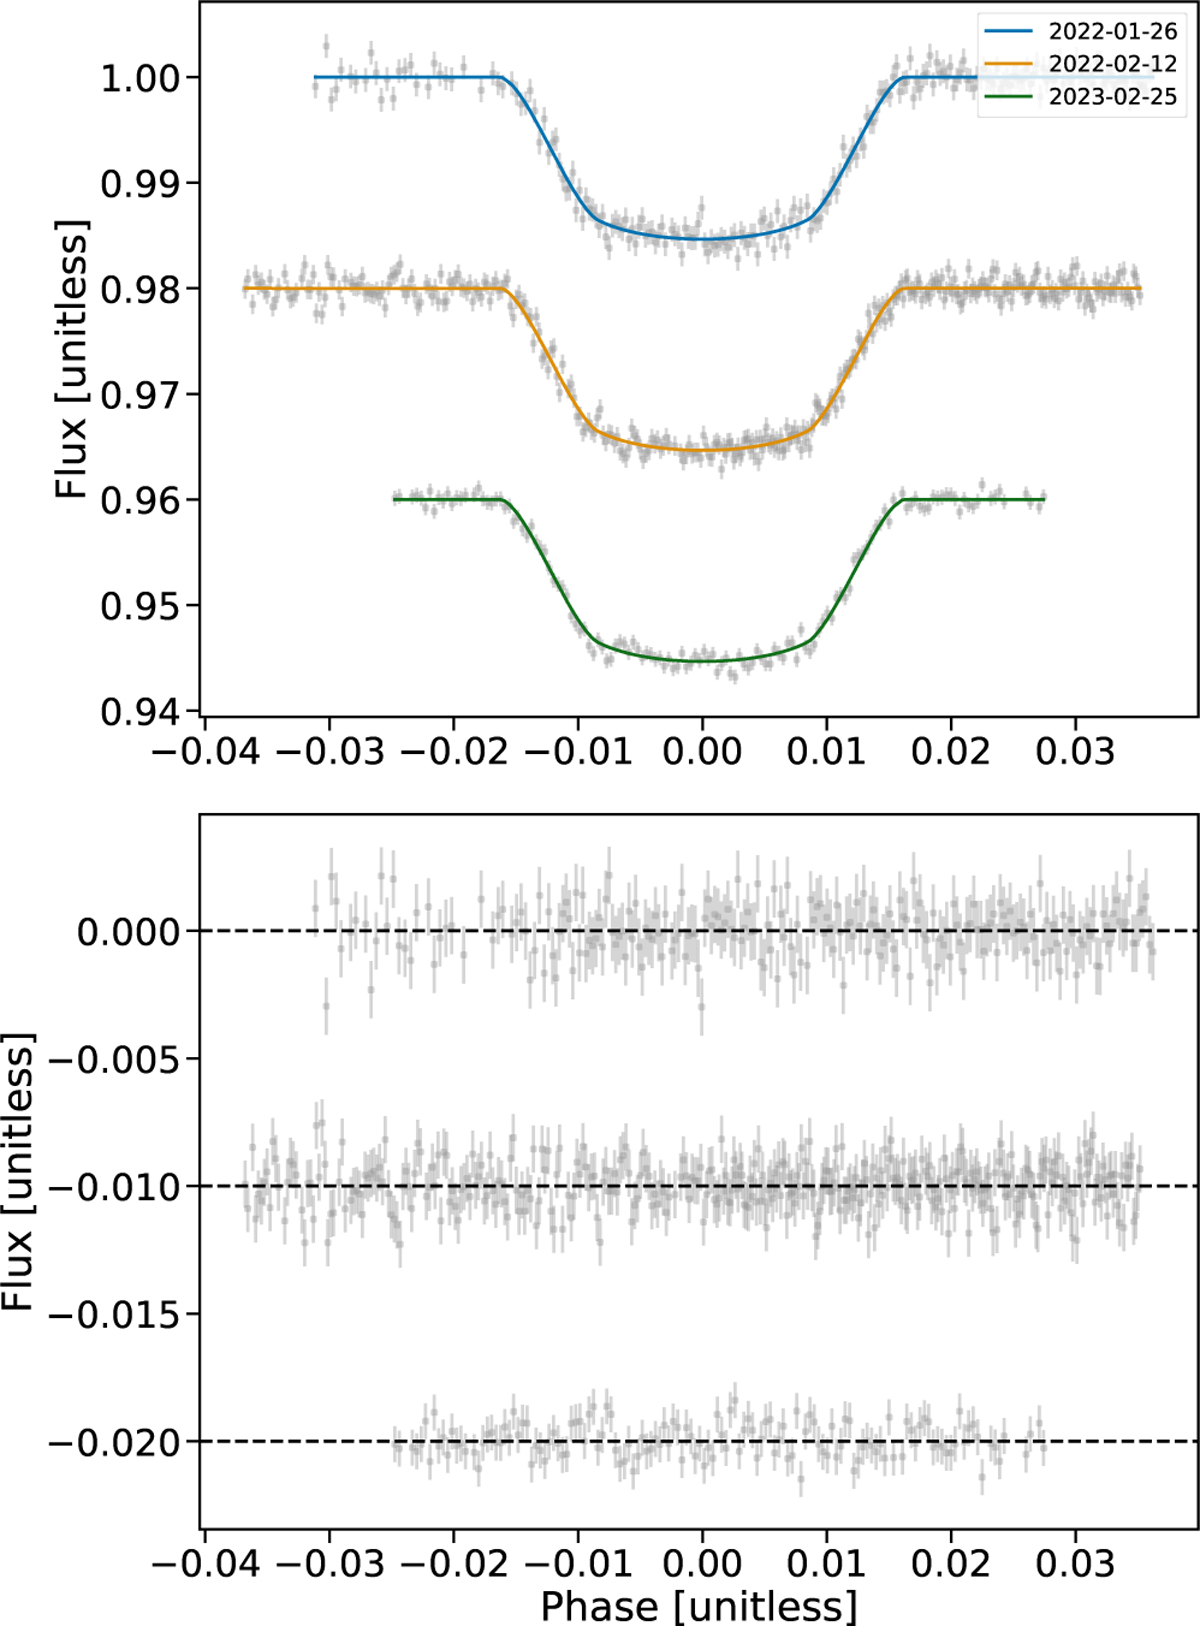
Fig. 3
Download original image
Observed simultaneous photometric light curves (top panels) from ECAM for the three ESPRESSO nights. The best-fit models from CONAN for each night are color-coded separately in blue (night #1), orange (#2), and green (#3). The residuals for each night are shown in the bottom panel with an offset. The horizontal line is the continuum of 0.
Current usage metrics show cumulative count of Article Views (full-text article views including HTML views, PDF and ePub downloads, according to the available data) and Abstracts Views on Vision4Press platform.
Data correspond to usage on the plateform after 2015. The current usage metrics is available 48-96 hours after online publication and is updated daily on week days.
Initial download of the metrics may take a while.