Fig. 4
Download original image
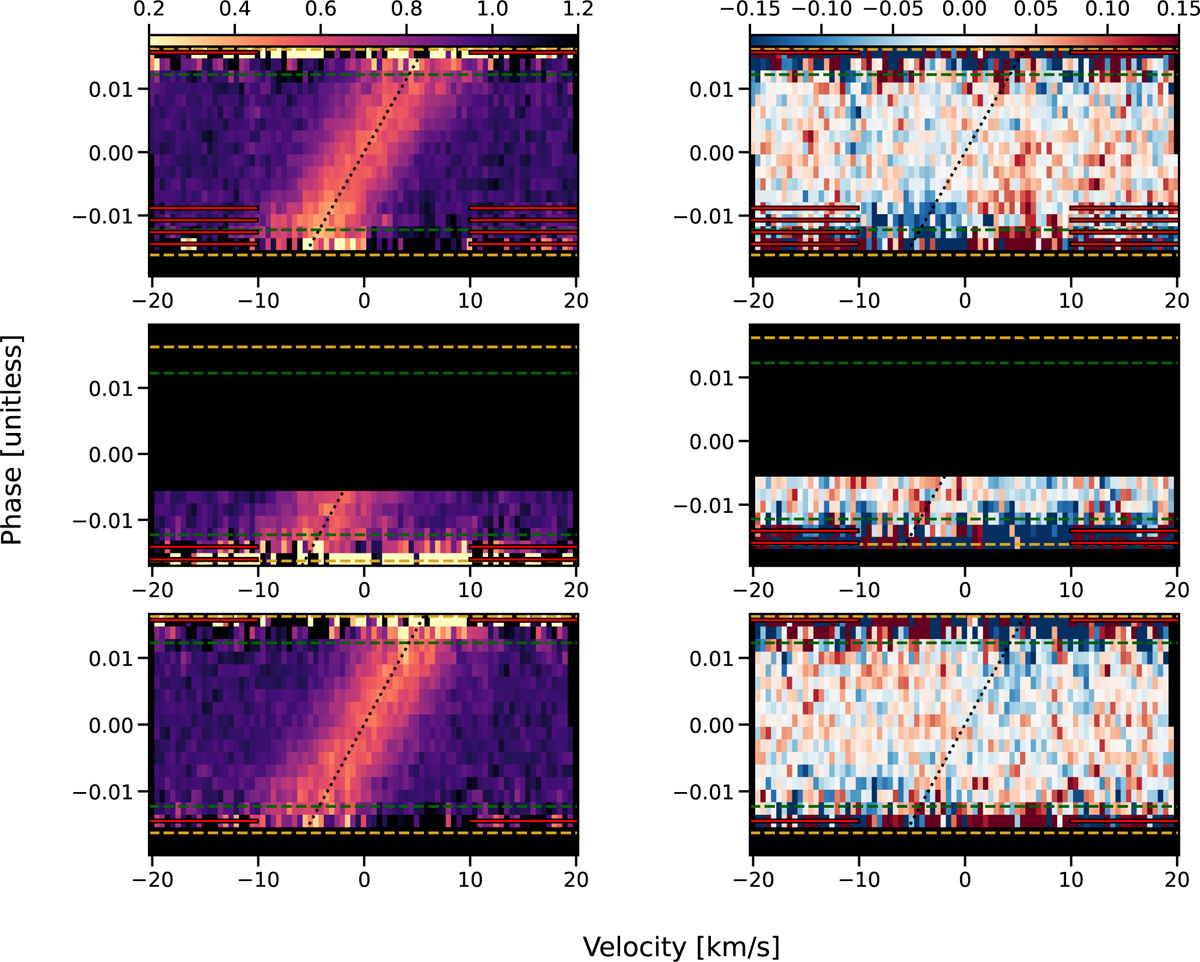
Intrinsic CCF per night (left panels) and their respective residuals (right panels). The RM signature is well visible during the transit as a bright track. The dashed horizontal lines correspond to T14 contact points (orange) and T23 (green). The solid red lines (with black outlines) correspond to spectra that were excluded from the analysis. The dotted black lines correspond to the expected local stellar velocity using the best-fit model. The first night’s residuals show a systematic trend, likely due to line asymmetry.
Current usage metrics show cumulative count of Article Views (full-text article views including HTML views, PDF and ePub downloads, according to the available data) and Abstracts Views on Vision4Press platform.
Data correspond to usage on the plateform after 2015. The current usage metrics is available 48-96 hours after online publication and is updated daily on week days.
Initial download of the metrics may take a while.