Fig. 6
Download original image
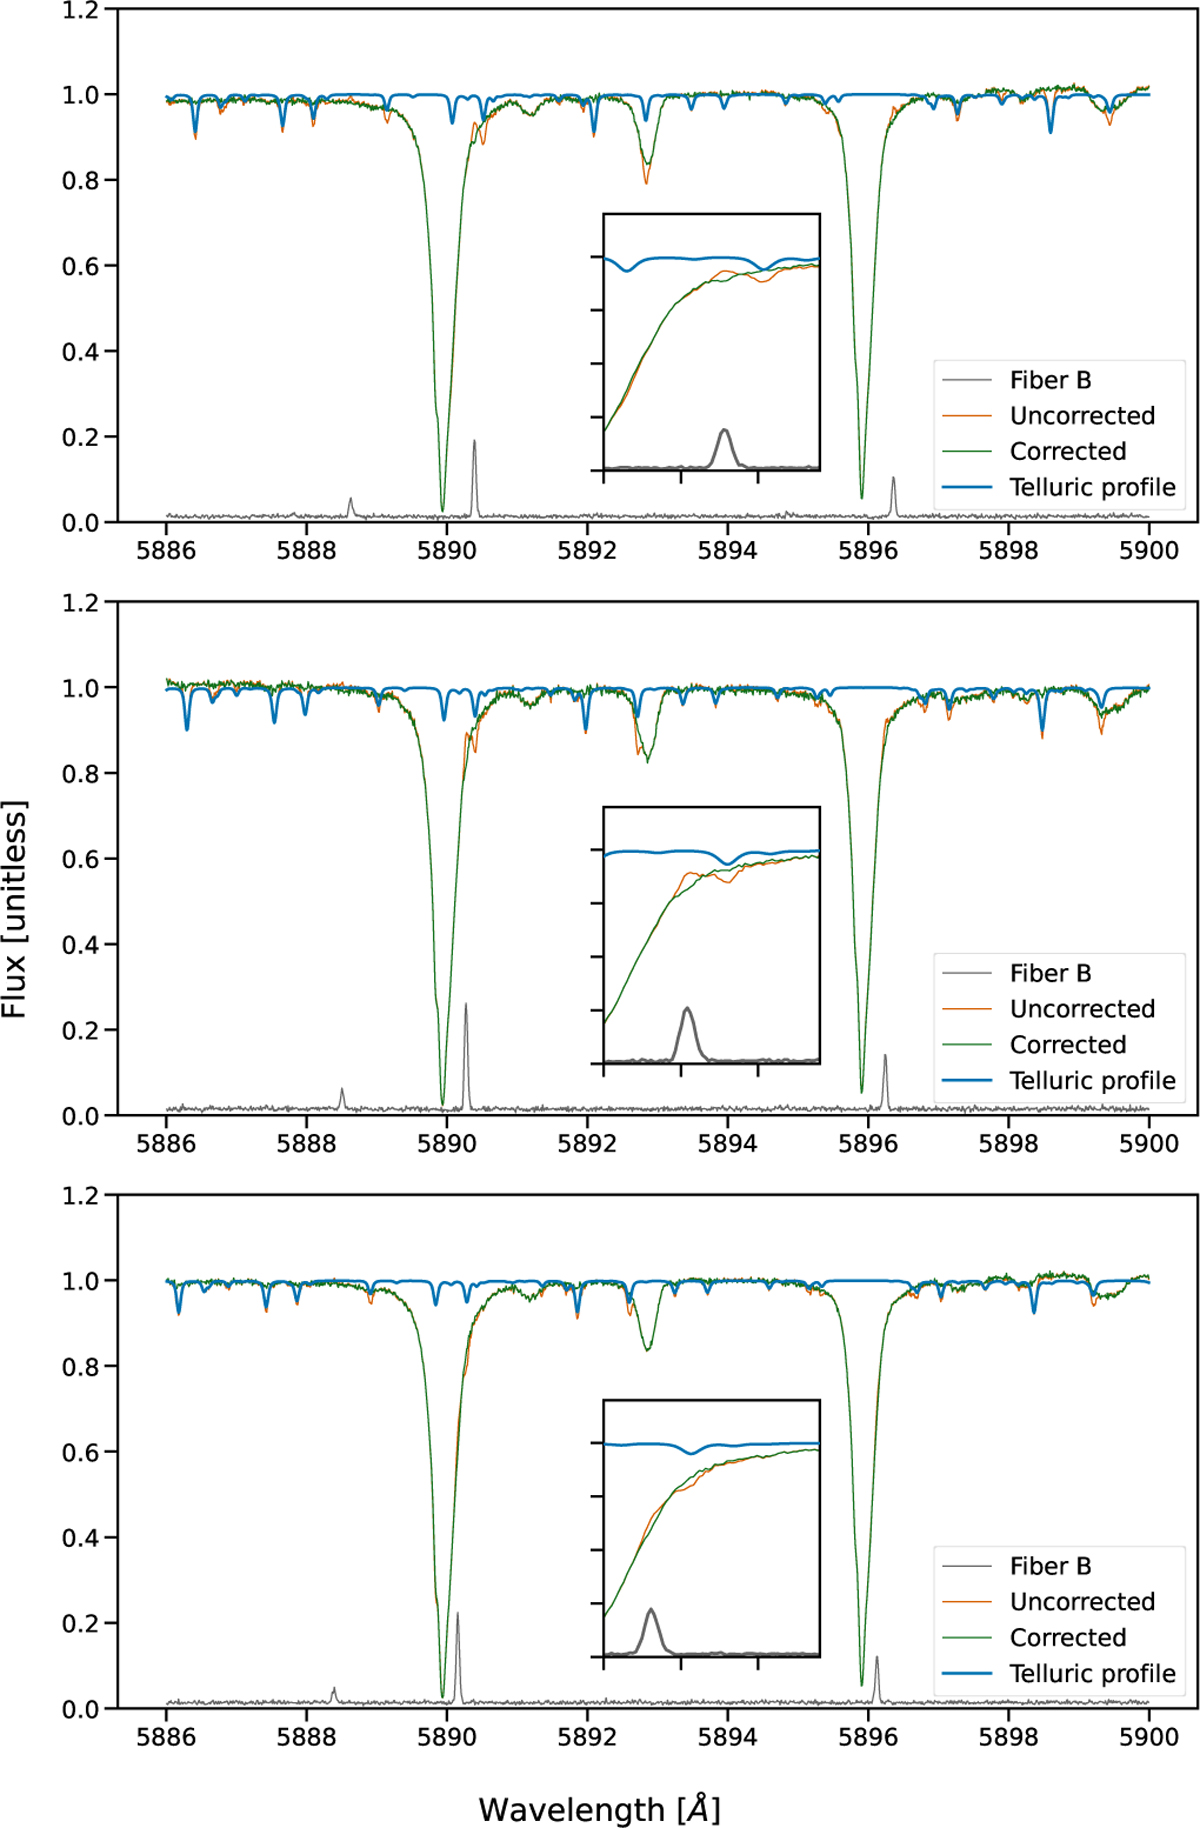
Correction for fiber B and telluric lines in the region of the sodium doublet. Each panel shows a respective night, with the master of raw spectra from fiber A (uncorrected for fiber B and telluric lines) in orange. In green, we show the master of fiber A spectra corrected for fiber B and telluric lines. The respective average telluric profile and fiber-B emission are shown in blue and gray, respectively. Please note that fiber B is on an arbitrary scale due to normalization. The zoomed-in image of the inset focuses on the wavelength region of 5890–5891 Å.
Current usage metrics show cumulative count of Article Views (full-text article views including HTML views, PDF and ePub downloads, according to the available data) and Abstracts Views on Vision4Press platform.
Data correspond to usage on the plateform after 2015. The current usage metrics is available 48-96 hours after online publication and is updated daily on week days.
Initial download of the metrics may take a while.