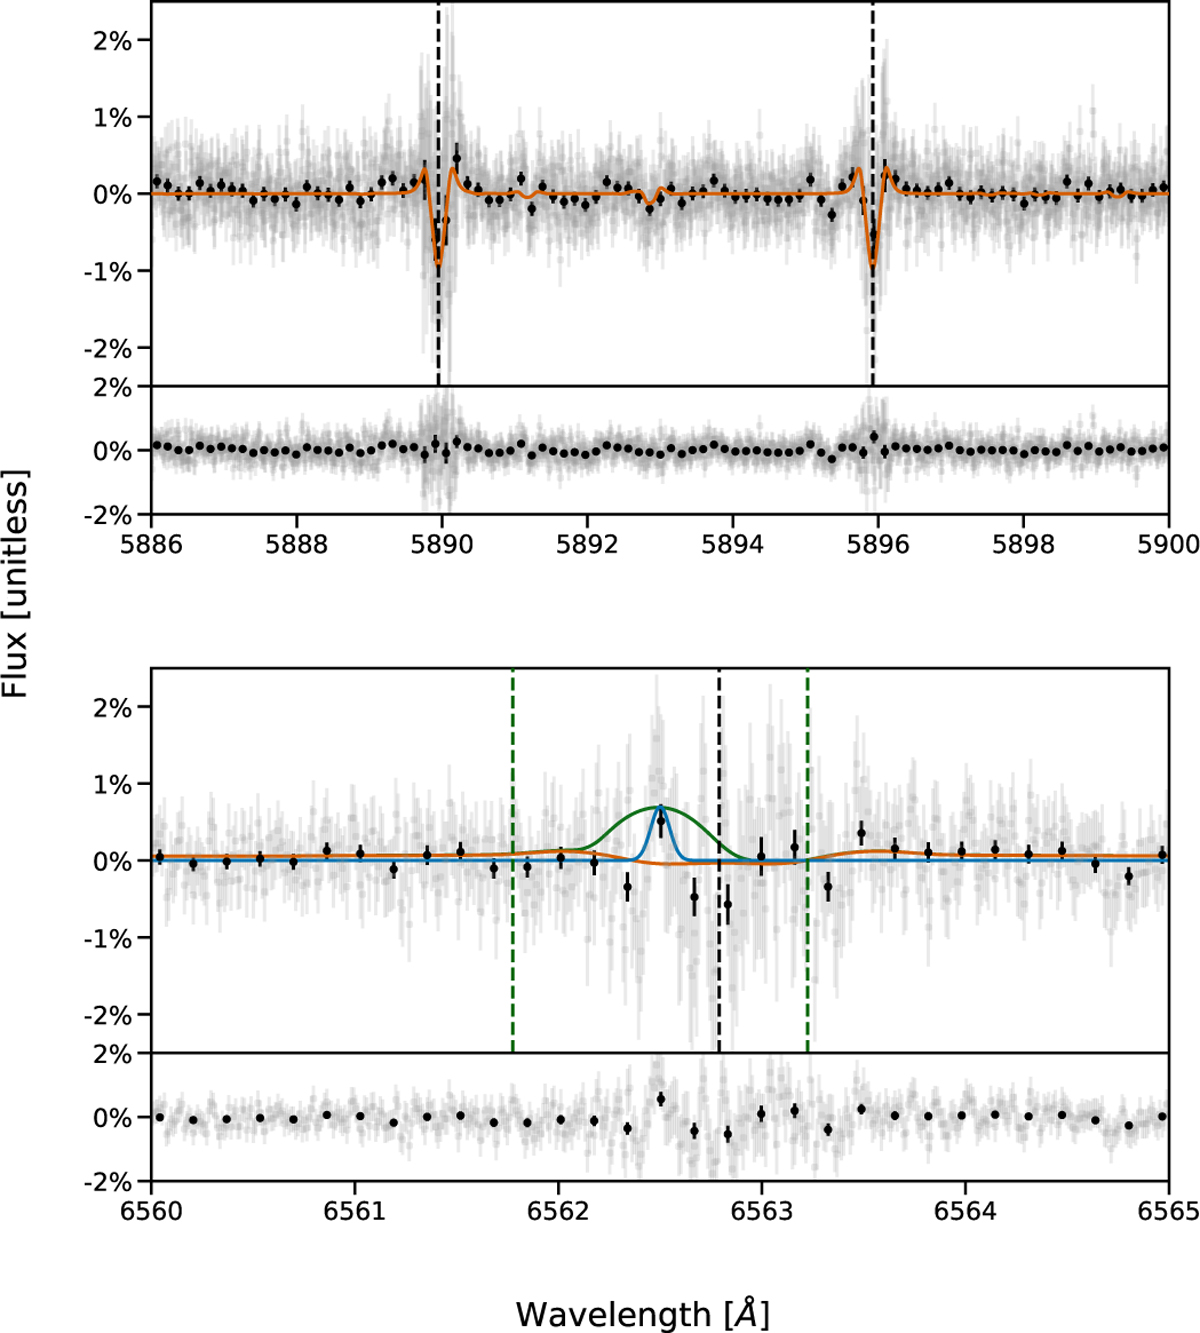
Fig. 8
Download original image
Combined transmission spectrum and its residuals of WASP-31b in the region of sodium doublet (top panels), and Balmer alpha line (bottom panels) in the rest frame of the planet. We plot the full spectrum in gray; that binned by 15x is shown in black. In this notation, absorption goes above zero, and “emission” is below. The laboratory position of the respective lines is shown via dashed black lines. The no-atmosphere model from EvE is plotted as an orange line, and the compound model with the atmosphere is shown as a green line. The vertical dashed green lines correspond to the escape velocity of ≈33 km/s, centered on the feature at 6562.5Å. The instrumental response function of ESPRESSO is centered on this feature in blue. Residuals were calculated assuming the no-atmosphere model.
Current usage metrics show cumulative count of Article Views (full-text article views including HTML views, PDF and ePub downloads, according to the available data) and Abstracts Views on Vision4Press platform.
Data correspond to usage on the plateform after 2015. The current usage metrics is available 48-96 hours after online publication and is updated daily on week days.
Initial download of the metrics may take a while.