Fig. 9
Download original image
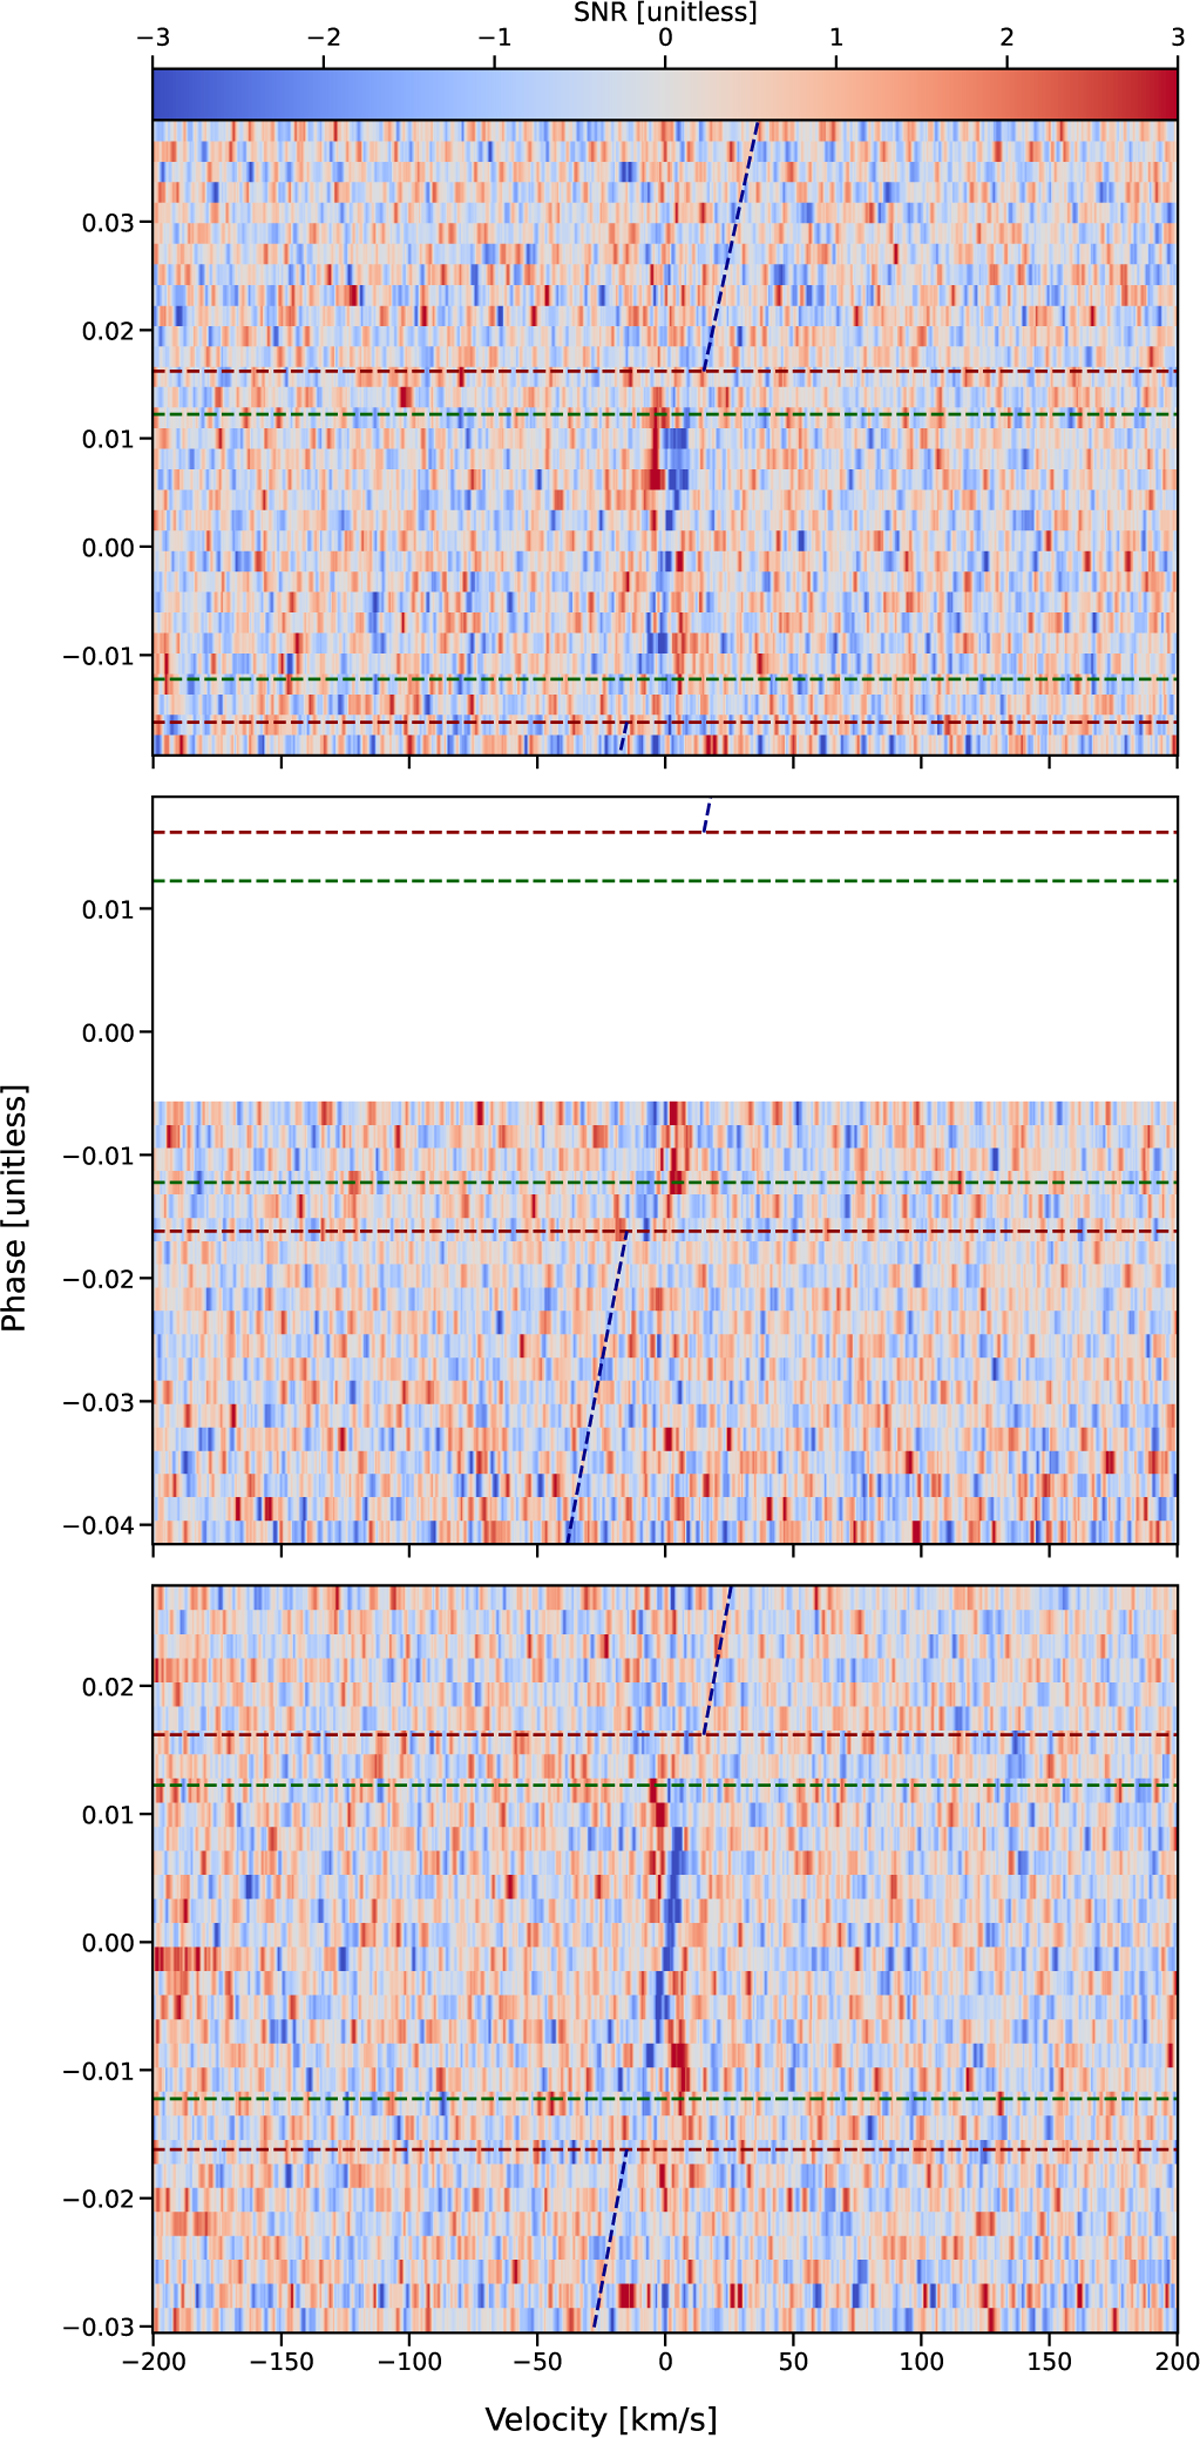
Phase-resolved cross-correlation of iron template with the dataset of WASP-31b, in the rest frame of the star. Each panel corresponds to a separate night (top panel for first night, middle for second, and bottom for third night). The contact points T1–T4 are plotted as red horizontal dashed lines, with contact points T2–T3 shown as horizontal dashed green lines. The planetary track is shown as a dashed line blue for the out-of-transit section. Absorption features are shown in red (positive) and negative features in blue.
Current usage metrics show cumulative count of Article Views (full-text article views including HTML views, PDF and ePub downloads, according to the available data) and Abstracts Views on Vision4Press platform.
Data correspond to usage on the plateform after 2015. The current usage metrics is available 48-96 hours after online publication and is updated daily on week days.
Initial download of the metrics may take a while.