Fig. A.1
Download original image
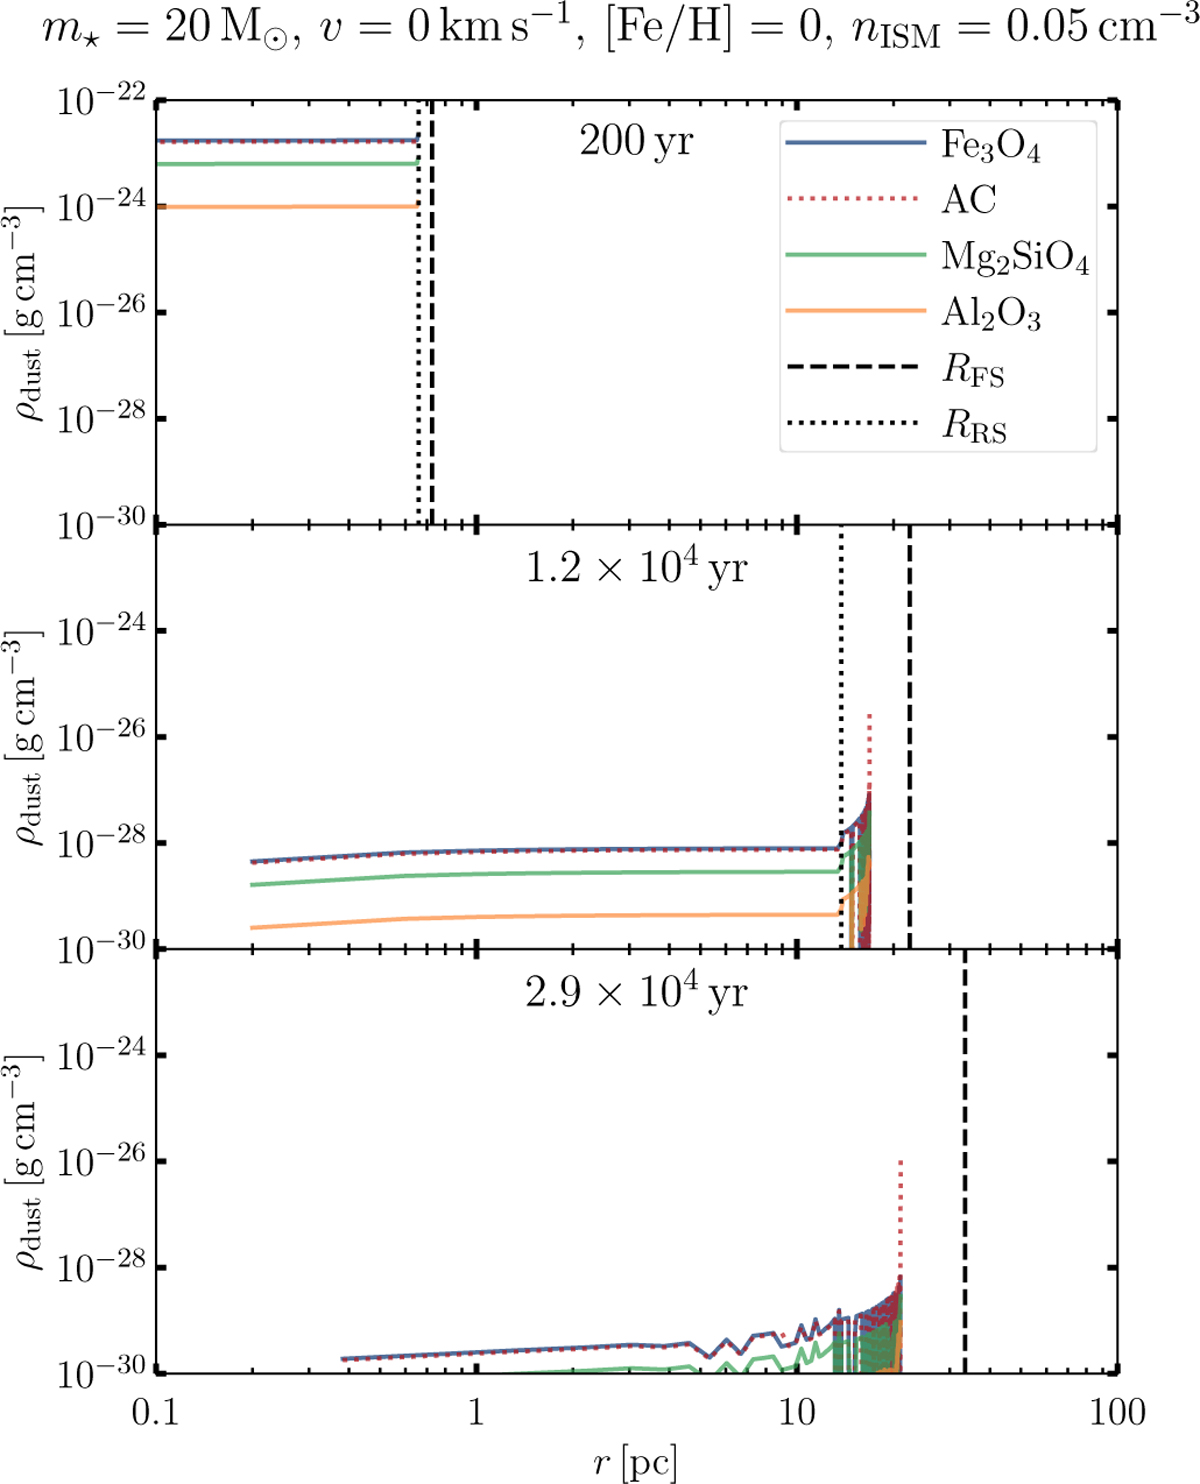
Dust density profile in the SN ejecta of the 20 M⊙ nonrotating progenitor with [Fe/H] = 0 within the ISM density of 0.05 cm−3. From top to bottom, each panel corresponds to the time of 200 yr, 1.2 × 10⁴ yr, and 2.9 × 10⁴ yr from the SN explosion. The blue, red, green, and orange lines represent FeO4, AC, Mg2SiO4, and Al2O3 grains. The vertical dashed and dotted lines indicate the positions of forward and reverse shocks.
Current usage metrics show cumulative count of Article Views (full-text article views including HTML views, PDF and ePub downloads, according to the available data) and Abstracts Views on Vision4Press platform.
Data correspond to usage on the plateform after 2015. The current usage metrics is available 48-96 hours after online publication and is updated daily on week days.
Initial download of the metrics may take a while.