| Issue |
A&A
Volume 708, April 2026
|
|
|---|---|---|
| Article Number | A136 | |
| Number of page(s) | 16 | |
| Section | Interstellar and circumstellar matter | |
| DOI | https://doi.org/10.1051/0004-6361/202555906 | |
| Published online | 01 April 2026 | |
Effective supernova dust yields from rotating and nonrotating stellar progenitors
1
Dipartimento di Fisica, “Sapienza” Università di Roma,
Piazzale Aldo Moro 5,
00185
Roma,
Italy
2
INAF/Osservatorio Astronomico di Roma,
Via Frascati 33,
00040
Monte Porzio Catone,
Italy
3
INFN, Sezione Roma I, Dipartimento di Fisica, “Sapienza” Università di Roma,
Piazzale Aldo Moro 2,
00185
Roma,
Italy
4
Sapienza School for Advanced Studies,
Viale Regina Elena 291,
00161
Roma,
Italy
5
Kavli Institute for the Physics and Mathematics of the Universe (WPI), The University of Tokyo Institutes for Advanced Study, The University of Tokyo, Kashiwa,
Chiba
277-8583,
Japan
6
INFN. Sezione di Perugia, via A. Pascoli s/n,
06125
Perugia,
Italy
7
INAF/Osservatorio Astronomico di Arcetri,
Largo E. Fermi 5,
50125
Firenze,
Italy
★ Corresponding author: This email address is being protected from spambots. You need JavaScript enabled to view it.
Received:
11
June
2025
Accepted:
29
January
2026
Abstract
Supernovae (SNe) are believed to be the dominant sources of dust production at high redshift. However, the reverse shock generated by the interaction of the SN forward shock and the interstellar medium (ISM) can significantly reduce the mass of newly formed dust in SN ejecta. This study quantifies the mass, composition, and grain size distribution of surviving dust after the passage of the reverse shock using the GRASHrev model. Our analysis covers a grid of SN models with progenitor masses of 13 M⊙ ≤ m⋆ ≤ 120 M⊙ and metallicity −3 ≤ [Fe/H] ≤ 0, and we explore, for the first time, the effect of stellar rotation, considering two initial velocities v = 0 and 300 km s−1. The SN explosions are assumed to occur in a uniform ISM with densities nISM = 0.05, 0.5, and 5 cm−3. We find that the larger grains (≳10 nm) are more resistant to destruction by the reverse shock, with amorphous carbon dominating the surviving dust mass in most models. The surviving dust mass decreases with increasing ISM density. For nonrotating progenitors, the maximum mass of dust surviving the passage of the reverse shock is ≃0.02 M⊙, and it is released by SN explosions of a 120 M⊙ progenitor with [Fe/H] = 0 in the ISM density 0.5 cm−3, corresponding to ≃4% of the initial dust mass before the passage of the reverse shock. Similarly, among the rotating progenitors, the maximum surviving mass fraction is ≃5%, with a final dust mass of ≃0.03 M⊙ in [Fe/H] = −1 models. Although the reverse shock has a strong destructive impact, our results indicate that on very short timescales of ≲30 Myr since the onset of star formation, SNe can enrich the ISM with carbonaceous grains ranging in size from approximately 1 nm to 100 nm (up to ≃1 μm in nonrotating models). This is especially notable given the recent detection of the 2175 Å UV extinction bump in galaxies at z > 6, suggesting the early presence of such dust.
Key words: supernovae: general / ISM: abundances / dust, extinction / galaxies: high-redshift
© The Authors 2026
 Open Access article, published by EDP Sciences, under the terms of the Creative Commons Attribution License (https://creativecommons.org/licenses/by/4.0), which permits unrestricted use, distribution, and reproduction in any medium, provided the original work is properly cited.
This article is published in open access under the Subscribe to Open model. This email address is being protected from spambots. You need JavaScript enabled to view it. to support open access publication.
1 Introduction
Understanding the origin of interstellar dust has a number of important astrophysical implications. The composition and size distribution of the grains affect their emission and extinction properties (Draine 2003). The dust content in the interstellar medium (ISM) controls the efficiency of H2 formation and hence the rate of star formation in galaxies (Stahler & Palla 2005). The presence of dust grains in low-metallicity star-forming regions affects the gas fragmentation scales and hence the nature of the originating stellar populations (Schneider et al. 2003, 2006, 2012a,b; Omukai et al. 2005; Marassi et al. 2014; Chiaki et al. 2014, 2015). Finally, gas heating due to photoelectric emission from interstellar dust grains is critical to maintaining the multiphase structure of the ISM (Wolfire et al. 2003).
In recent years, deep millimeter observations of high-z galaxies have been able to detect their ISM dust continuum emission, indicating that rapid dust enrichment can already occur at z > 6 not only in luminous quasars (Valiante et al. 2014; Calura et al. 2014; Venemans et al. 2018) or ultraluminous infrared galaxies (Marrone et al. 2018; Hashimoto et al. 2019), but also in normal star forming systems, which are more representative of the bulk of the galaxy population at those redshifts (Watson et al. 2015; Laporte et al. 2017; Knudsen et al. 2017; Hashimoto et al. 2018; Bowler et al. 2018; Tamura et al. 2019). A systematic analysis of the dust content in star-forming galaxies at z > 4 has recently come from two ALMA Large Programs, the ALPINE survey targeting galaxies at 4 ≤ z ≤ 6 (Le Fèvre et al. 2020; Pozzi et al. 2021) and the REBELS survey (Bouwens et al. 2022; Sommovigo et al. 2022; Inami et al. 2022) targeting galaxies at 6 ≤ z ≤ 8. Despite the uncertainties affecting the dust mass determination, when only one far-infrared continuum data point is available (see however Witstok et al. 2023a; Algera et al. 2024), these observations provide evidence in support of the existence of a fast and efficient dust formation channel, in agreement with model expectations (Mancini et al. 2015, 2016; Popping et al. 2017; Vijayan et al. 2019; Graziani et al. 2020; Dayal et al. 2022; Ferrara et al. 2022; Di Cesare et al. 2023; Palla et al. 2024).
On timescales of ≲30–40 Myr, core-collapse supernovae (SN) provide the dominant source of dust enrichment (see Schneider & Maiolino 2024 for a recent review). On longer timescales, the most massive among stars in the asymptotic giant branch start to contribute, but their importance depends on the star formation history, on the stellar initial mass function (Valiante et al. 2009; Schneider et al. 2014), and on their mass- and metallicity-dependent dust yields (Zhukovska et al. 2008; Ferrarotti & Gail 2006; Ventura et al. 2012b,a, 2014, 2018; Dell’Agli et al. 2014, 2015, 2016, 2017; Nanni et al. 2013, 2014, 2015, 2016).
Core-collapse SN dust yields have been computed by a number of studies within the framework of standard nucleation theory (Kozasa et al. 1991; Todini & Ferrara 2001; Nozawa et al. 2003, 2010; Schneider et al. 2004; Bianchi & Schneider 2007; Marassi et al. 2014, 2015, 2019), or following a kinetic approach (Cherchneff & Dwek 2009, 2010; Sarangi & Cherchneff 2013, 2015; Sluder et al. 2018; Lazzati & Heger 2016; Brooker et al. 2022). Despite the high efficiencies of grain condensation in SN ejecta, it has become clear that not all the newly formed dust makes its way to the ISM, due to the processing of newly formed grains in SN remnants (Dwek 2005; Bianchi & Schneider 2007; Nozawa et al. 2007; Nath et al. 2008; Silvia et al. 2010, 2012; Marassi et al. 2015; Bocchio et al. 2016; Biscaro & Cherchneff 2016; Micelotta et al. 2016; Martínez-González et al. 2019; Kirchschlager et al. 2019; Slavin et al. 2020; Kirchschlager et al. 2023, 2024). The destructive effect of the SN reverse shock generated by the interaction of the SN forward shock and the ISM is expected to reduce the mass of newly formed dust, to modify its size distribution, and to affect the relative abundance of different dust species. It is therefore very important to quantify these effects for at least two reasons:
(i) The ISM dust enrichment from SN is expected to be the dominant source of dust production at very high redshift and in chemically less evolved galaxies, with M⋆ ≲ 2.5 × 10⁸ M⊙ at z ≥ 4 (see, e.g., Mancini et al. 2015, 2016; Graziani et al. 2020; Di Cesare et al. 2023).
(ii) The size distribution and composition of surviving dust grains have important implications for the subsequent dust evolution in the ISM (see, e.g., Hirashita 2013). Indeed, small grains will be more vulnerable to destruction by interstellar shocks (Nozawa et al. 2006; McKee 1989; Jones & Nuth 2011; Bocchio et al. 2014), but their larger surface-to-volume ratio will enhance the efficiency of grain growth in the cold neutral medium (Weingartner & Draine 1999; Asano et al. 2013, 2014; Zhukovska et al. 2016, 2018). The latter effect has been shown to be required by chemical evolution models with dust in order to reproduce the observed large dust masses (Rowlands et al. 2014; Valiante et al. 2014; Michałowski 2015; Mancini et al. 2015; Popping et al. 2017; Graziani et al. 2020) and dust scaling relations (Schneider et al. 2016; Ginolfi et al. 2018; Di Cesare et al. 2023). Additionally, the grain size distribution impacts grain charging and the optical properties of the grains, with important implications for the propagation of radiation in the dusty medium and the physical properties of the multiphase ISM (Glatzle et al. 2019, 2022).
In this paper, we explore the effect of the SN reverse shock by considering a grid of SN models with varying progenitor initial mass, metallicity, and rotational velocity. Although the dependence on stellar rotation is indirect, as it affects the initial dust composition and grain size distribution, which in turn influences the survival of dust after reverse shock processing, this aspect introduces a novel dimension to the modeling. To this aim, we adopted the dust yields computed by Marassi et al. (2019) for the grid of SN models with progenitor masses ranging between 13 and 120 M⊙, initial metallicity varying from [Fe/H] = −3 to [Fe/H] = 0, and two different values of the rotation rate, v = 0 and 300 km s−1 (Limongi & Chieffi 2018). To quantify the impact of the reverse shock, we used the GRASHrev model described in Bocchio et al. (2016) and explored SN explosions with a fixed energy of 1.2 × 1051 erg expanding in uniform ambient media with constant densities of nISM ≃ 0.05, 0.5, and 5 cm−3. The results of these calculations are meant to provide a quantitative estimate of the “effective” dust yields (the mass of dust that each SN is able to inject into the ISM) for a large grid of SN models and ambient medium densities to be used in chemical evolution models with dust to assess the importance of SNe as dust producers.
The paper is organized as follows. In Section 2 we summarize the main results of previous works. In Section 3, we briefly describe the grid of SN dust yields computed by Marassi et al. (2019) that we used as an input to the GRASHrev calculations. In Section 4, we recall the main features of the GRASHrev model (Bocchio et al. 2016), and we present the results of the calculations in Section 5. Our main findings and their implications for early cosmic dust enrichment are discussed in Section 6. Finally, in Section 7 we draw our main conclusions.
2 Previous works
There are still large uncertainties on the amount of newly formed dust in SN ejecta that survives the passage of the reverse shock (see the recent reviews by Micelotta et al. 2018 and Schneider & Maiolino 2024). Some studies have used analytic approximations to describe the expansion of the SN blast wave and the dynamics of the reverse shock and have followed dust destruction by thermal and nonthermal sputtering (Nozawa et al. 2007; Bianchi & Schneider 2007; Micelotta & Dwek 2013; Micelotta et al. 2016; Bocchio et al. 2016). The general conclusions of all these studies are that the fraction of dust that survives ranges between ~20% and less than a few percent, depending on the density of the medium into which the remnant is expanding, the supernova explosion energy, and the composition and size distribution of the grains that originally formed in the ejecta. Hence, the results differ for different types of supernovae and likely depend on the metallicity and mass of the progenitor star.
In Bocchio et al. (2016), the evolution of ejecta dust was modeled for four SNe in the Milky Way and the Large Magellanic Cloud (SN 1987A, Cas A, the Crab Nebula, and N49), and the model predictions were directly compared with the available observational data. For each individual SN, the predicted dust masses are in reasonable agreement with the presently observed values. However, the largest fraction of dust destruction is predicted to occur between 103 and 105 yr after the explosion, while the oldest SN in the sample has an estimated age of ~4800 yr. Furthermore, the reverse shock of SN 1987A has recently been detected (Larsson et al. 2023). For the Crab Nebula, our modeling indicated that the reverse shock had reduced the dust mass by <30% at the time of observation-likely an upper limit since the reverse shock will develop on ≈104 yr timescales (Blondin et al. 2001), while the remnant is only ≈970 yr old. Consequently, these observations can only provide an upper limit to the mass of dust that will eventually be injected into the ISM.
A different approach was undertaken by Silvia et al. (2010, 2012) and more recently by Martínez-González et al. (2019); Kirchschlager et al. (2019, 2020, 2023, 2024); Slavin et al. (2020); Vasiliev & Shchekinov (2024); Serrano-Hernández et al. (2025). These authors used hydrodynamic simulations to investigate the destruction of newly formed dust by the SN reverse shock. Silvia et al. (2010, 2012) used an idealized setup of a planar wave impacting on a dense spherical ejecta clump (cloud-crushing problem) in which they have implanted a distribution of Lagrangian particles to represent a population of grains whose sizes and composition were taken from the computation of Nozawa et al. (2007) (for a SN progenitor of 20 M⊙ with unmixed ejecta). They found that the dominant factor determining the degree of grain destruction is the relative velocity between the reverse shock and the ejecta cloud, with a threshold shock velocity between 1000–3000 km s−1 above which grain survival drops considerably. Their results indicate the grains with initial radii less than 0.1 μm are often completely destroyed, while larger grains survive their interaction with the reverse shock. Martínez-González et al. (2019) used a 3D hydrodynamic simulation to explore the expansion of SN ejecta in a preexisting wind-driven bubble. In this case, a higher survival fraction is found because the SN remnant evolves into a lower-density medium excavated by the wind. They assumed a single SN with a progenitor star of 60 M⊙ that produces 0.5 M⊙ of ejecta dust, and found that if the expansion occurs in a uniform ambient medium with density n = 1 cm−3 (n = 1000 cm−3) the dust survival fraction is <32% (0%, see their Table 1). However, with a preexisting wind-driven bubble in the same ambient media, the survival fractions increase to ~95%. The crucial parameter here is the mass ratio between the mass of the wind-driven shell and the mass of the ejecta, which they have assumed to be χ = 400 (χ = 2 × 10⁴). In all these studies, however, perfect coupling between dust and gas is assumed and they do not consider the effects of non-thermal sputtering and shattering by grain-grain collisions. Kirchschlager et al. (2019) used 2D hydrodynamics simulations to follow the interactions between grains and gas particles mediated by sputtering and grain-grain collisions in a cloud-crushing problem, showing that the probabilities of grain-grain collisions can be enhanced if the grains reside in over-dense clumps within the ejecta; using 3D simulation with a similar setup, Kirchschlager et al. (2020) show that this effect can be partly counteracted by ion trapping on silicate grains and grain growth. In addition, a significant lower fraction of dust survives when including the effects of the magnetic field on the dynamics of charged grains (Kirchschlager et al. 2023), as the betatron acceleration can cause kinetic decoupling between gas and dust, enhancing grain sputtering (Slavin et al. 2015). Moreover, the presence of a magnetic field in the shocked ISM can reflect and confine the grains within the inner region of the SN remnant (Fry et al. 2020).
The dust survival rate is also strongly affected by the conditions under which the reverse shock hits the dusty clumps in the ejecta. Kirchschlager et al. (2024) find a strong dependence on the remnant age, with most of the destruction occurring in the first 200 yr from the explosion, and almost total survival for clumps that are first impacted at ages beyond 1000 yr. Serrano-Hernández et al. (2025) examined various scenarios based on the shape of the circumstellar medium (CSM) created by massive stellar eruptions, and the time that had elapsed prior to the SN explosion. They find that a larger fraction of the dust mass can survive if the SN occurs just a few years after the eruption event, due to strong radiative cooling induced by high CSM densities, which weakens the forward and the reverse shocks. While the above studies show that the structure of supernova ejecta plays a critical role in determining dust survival, in our study we adopted a one-dimensional homogeneous ejecta model and we discuss the effects of this limitation in Section 6.
Finally, we shall note that here we are focusing on the effective dust yields released by individual supernova explosions. Sequential supernova explosions originating from a coeval massive star cluster embedded in a clumpy molecular cloud may lead to different resulting dust masses, due to the partial destruction of SN-injected grains by subsequent explosions. On timescales of ≃2.5 Myr, this can be partly compensated by dust grain growth in the emerging super-bubble swept up super-shell, as shown by Martínez-González et al. (2022). While these effects are clearly important to consider when modeling the time evolution of the dust mass in galaxies, here we limit our study to estimating the mass, composition and size distribution of grains released by individual stellar explosions.
3 The grid of SN dust yields
The grid of SN dust yields that we use as an input to the reverse shock calculations has been computed and thoroughly described in Marassi et al. (2019). Here we briefly summarize the main features that are relevant to the reverse shock calculations, while we refer the reader to the original paper for more details.
The mass, composition, and size distributions of dust grains formed in SN ejecta have been computed using Classical Nucleation Theory. We adopted an improved version of the model of Bianchi & Schneider (2007) that accounts for the non-steady-state formation of important molecular species (Marassi et al. 2014, 2015). In particular, while the ejecta expands, we follow the formation and destruction rates of CO, SiO, C2, and O2 molecules, which play an important role in catalyzing or suppressing some reaction rates that lead to dust formation. We have computed the nucleation and accretion of seven different grain species: amorphous carbon (AC), iron (Fe), corundum (Al2O3), magnetite (Fe3O4), enstatite (MgSiO3), forsterite (Mg2SiO4), and quartz (SiO2).
Grain condensation depends on the ejecta temperature and density, whereas grain composition depends on the relative abundances of refractory elements, which, in turn, depend on the nature of the SN progenitor (mass, metallicity, rotation) and on the explosion energy (see also Schneider & Maiolino 2024). Following Marassi et al. (2019), we adopt the thermal, dynamical, and chemical evolution of the ejecta as predicted by one-dimensional supernova explosion simulations, assuming a constant explosion energy of 1.2 × 1051 erg (the fixed energy sample analyzed in Marassi et al. 2019). The initial time of the calculation, tini, is set by requiring that the gas temperature at the radius of the helium core, RHe, core, reaches a value of T0 = 104 K, which is fixed in our model. For times t ≥ tini, the ejecta are assumed to expand adiabatically, with the temperature evolving according to
![Mathematical equation: $\[T(t)=T_0\left[1+\frac{v_{\mathrm{eje}}}{R_0}\left(t-t_{\mathrm{ini}}\right)\right]^{3(1-\gamma)},\]$](/articles/aa/full_html/2026/04/aa55906-25/aa55906-25-eq1.png) (1)
(1)
where γ = 1.41 is the adiabatic index, and T0, R0, and veje are the temperature, radius of the He core, and ejecta velocity at t = tini, respectively.
3.1 SN models
The pre-SN evolution is simulated with the FRANEC code (Chieffi & Limongi 2013; Limongi & Chieffi 2018), taking into account the effects of stellar rotation and metallicity. The model grid spans a range of initial stellar masses, [13–120] M⊙, that are assumed to explode with a fixed-energy of 1.2 × 1051 ergs (see for more details the description of fixed-energy models in Marassi et al. 2019). We assume two possible initial rotation rates of the stars, v = 0 (nonrotating models) and v = 300 km s−1 (rotating models). Finally, we also consider 4 different initial metallicity values: [Fe/H] = 0, −1, −2, and −3. A thorough description of the properties of the SN models can be found in Chieffi & Limongi (2013) and Limongi & Chieffi (2018).
Tables 1–4 in Marassi et al. (2019) report the main properties of the SN models, including a classification of their type1, and Tables 9 and 10 present their associated total dust yields. At the high progenitor mass-end, some of the entries in these Tables are missing either because the stars fail to explode (the ejecta do not contain enough material to trigger dust formation) or because their He cores are large enough to trigger pair production, the stars become pulsationally unstable, and then their evolution can no longer be properly followed with FRANEC (Limongi & Chieffi 2018).
Here, we report in the Appendix the initial dust mass in all grain species predicted for each of the fixed-energy SN models. In the next two subsections, we briefly summarize the main characteristics of this data.
The mass of dust formed in the ejecta depends on the metal abundances and on their spatial distribution. In the preSN phase, the models are characterized by a large variety of chemical species. However, during the explosion, the ejecta mass can be significantly reduced by fallback, in which some of the material initially ejected fails to escape the gravity of the newly formed compact object (neutron star or black hole) and instead falls back onto it. This effect is particularly important for the most massive progenitors, which are characterized by larger binding energies. As a result, the mass of dust produced in the ejecta decreases for progenitor stellar masses above ~25–30 M⊙ but in a non-monotonic way.
3.2 Dust yields for nonrotating models
For nonrotating stellar progenitors, the vast majority of the SN explosions are of type IIP and Ib. The mass of dust produced depends on the progenitor mass and metallicity. The most efficient dust producers are SN models with progenitor masses m⋆ ~ 20–25 M⊙ that are able to synthesize up to mdust ~ 1.2 M⊙ of dust. For m⋆ < 20–25 M⊙, the dust mass increases with progenitor mass, while for m⋆ > 20–25 M⊙ it drops due to the effect of fallback, reaching values of mdust ~ 0.2–0.4 M⊙ for the higher metallicity models ([Fe/H] = 0 and −1) and dropping to mdust ~ 0.01–0.02 M⊙ for models [Fe/H] = −2. At even lower metallicity, no dust is formed in SN ejecta with progenitors larger than 30 M⊙ (see Fig. 8 in Marassi et al. 2019 and the top solid lines in Fig. 1).
The dust composition is very sensitive to the metallicity and mass of the stellar progenitors (see Fig. 10 in Marassi et al. 2019). At higher metallicity ([Fe/H] = 0 and −1), a variety of dust species form in the SN ejecta with progenitor masses m⋆ < 30 M⊙, while SN with larger progenitors form mostly AC grains. At lower metallicity ([Fe/H] = −2 and −3), silicates can only form in a very limited number of SN models (those with progenitor masses in the range 20–25 M⊙), while in all the other models the dominant grain species are AC and Fe3O4. The total dust mass and the mass of individual dust species for nonrotating SN models with different initial mass and metallicity are reported in Table A.1.
3.3 Dust yields for rotating models
The effects of rotation-induced mixing are to increase the mass loss during the pre-SN evolution and to favor the formation of larger He and CO cores. Therefore, for the same initial stellar mass and metallicity, rotating models are characterized by a smaller mass at the onset of the SN explosion compared to nonrotating ones (see Tables 1–4 in Marassi et al. 2019). As a result, except for the smallest initial stellar masses (m⋆ < 30 M⊙) with [Fe/H] ≤ −1, all rotating models explode as type Ib SNe. However, rotation-induced mixing also leads to more metal-enriched ejecta and all rotating models with [Fe/H] = 0, −1 are able to form dust in their ejecta (there are no failed SN models).
Within the grid of models used for the present analysis, the upper mass limit for a successful dust-producing SN is set by the onset of pair-production and of the associated pulsational instability that is experienced by stars with initial [Fe/H] = −2 and −3 and initial masses m⋆ ≥ 80 M⊙ due to their larger He cores compared to nonrotating models. While we cannot follow the evolution of pulsationally unstable stars with FRANEC, we shall note that pair-instability supernovae are expected to produce a large amount of dust, as shown by Nozawa et al. (2003), Schneider et al. (2004), and Cherchneff & Dwek (2009, 2010).
The total dust mass produced by rotating models ranges from a minimum value of mdust ≃ 2.6 × 10⁻³ M⊙ to a maximum value of 2.2 M⊙ with a strongly non-monotonic behavior with initial stellar mass and metallicity (see the top solid lines in all the panels of Fig. 2).
Similar to nonrotating models, rotating stars with initial masses <40 M⊙ (for [Fe/H] = 0) and <20 M⊙ for [Fe/H] = −3) are able to synthesize a variety of grain species during their SN explosions. Conversely, SN with more massive progenitors mostly form AC grains. However, independent of metallicity, rotation leads to a more efficient formation of silicates and to a less efficient formation of AC grains in low-mass progenitors. Indeed, the physical conditions present in the ejecta of rotating models promote the formation of SiO and CO molecules that, in turn, affect the relative abundance of silicates and AC grains.
The total dust mass and the mass of individual dust species for rotating SN models with different initial mass and metallicity are reported in Table A.2.
3.4 Grain size distributions
It is important to stress that – for both rotating and nonrotating models – the grain size distribution is also very sensitive to the SN progenitor properties (as an example, see Fig. 3). In general, the size distribution has a lognormal or bimodal shape, but the amplitude and peak size depend on the density at the onset of nucleation. Hence, SN models where the adiabatic expansion of the ejecta starts at smaller radii tend to form larger grains. Similarly, for a given SN model, the dust species whose nucleation starts earlier in the ejecta evolution (because of the larger dust nucleation temperature and/or higher concentration of key species in the gas phase), such as AC grains, are characterized by larger grain sizes. This has important consequences for grain survival during the passage of the reverse shock, as we demonstrate in the next sections. The different properties of SN explosions from rotating and nonrotating progenitors also affect the emerging grain size distribution at the end of the nucleation phase. Due to the lower ejecta density, rotating progenitors produce smaller grains. In general, the size distribution has a lognormal or a bimodal shape with sizes ranging from ≃1 nm to ≃100 nm (≃1 μm) for rotating (nonrotating) models.
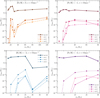 |
Fig. 1 Dust mass in SN ejecta as a function of the initial mass of nonrotating progenitor stars. Each panel corresponds to a different metallicity: [Fe/H] = 0 (top left), [Fe/H] = −1 (top right), [Fe/H] = −2 (bottom left), and [Fe/H] = −3 (bottom right). The solid, dotted, dashed, and dash-dotted lines represent no-rev, rev1, rev2, and rev3 models in each panel. |
4 SN reverse shock modeling
In this section, we briefly summarize the main features of the GRASHrev model (Bocchio et al. 2016), which we used to quantify the impact of the reverse shock on the mass, composition, and size distribution of dust grains produced by the SN models described in Section 3. In GRASHrev, the evolution of the SN remnant into a uniform ambient medium is described by the unified, self-similar solution of Truelove & McKee (1999), which fits a spherically symmetric, non-radiative hydrodynamical simulation from the Ejecta Dominated (ED, when the ejecta is in free-expansion) to the Sedov-Taylor (ST, when the mass of the interstellar material swept up by the shock wave becomes comparable to the mass of the ejecta) phases. The solution provides the position (with respect to the center of the explosion) and velocity of the forward and reverse shocks, but it breaks down when the velocity of the forward shock drops below ~200 km s−1, and the remnant enters the pressure-driven snowplough (PDS) phase, where radiative losses can no longer be neglected. An analytic solution for this final phase is provided by Truelove & McKee (1999) and appears to be in good agreement with the results of the radiative hydrodynamic simulations of Cioffi et al. (1988) and Slavin et al. (2015). Here we assume a uniform ejecta with n = 0, where n is the ejecta power-law index entering the (Truelove & McKee 1999) equations. The transition time from the ED and ST phases depends on the explosion energy, ejecta mass, and ISM density. The radius of the reverse shock is calculated from t = 0, and it decreases during the ST phase, arriving at the center of the explosion in a timescale of ≃104 yr (see Fig. 1 in Bocchio et al. 2016).
The ejecta and the surrounding ISM (out to a distance of 200 pc from the center of the ejecta) are divided in Ns = 400 spherical shells. Before being crossed by a shock, the ejecta shells are assumed to be in homologous expansion and their temperature decreases adiabatically, while the ISM shells are assumed to be at rest. The timescales of the simulation are set by the time Δt required by the reverse shock to cross one shell. When a shell is crossed by a shock, its temperature, density and velocity change according to the Rankine-Hugoniot jump conditions (see Bocchio et al. 2016 for additional details).
Initially, in the un-shocked ejecta, dust and gas are assumed to be uniformly mixed and perfectly coupled (they expand at the same velocity). However, when a given shell is hit by the reverse shock, the gas and dust respond differently, they decouple, and the grains time-dependent velocity is reduced according to the combined effects of collisional and plasma drag (see Eq. (13) in Bocchio et al. 2016). We do not consider the presence of a magnetic field, which can modify the velocity of charged grains. While this effect can be relevant when inhomogeneities (clumps, filaments) or turbulent fields are considered (see the discussion in Section 2), it is likely to be negligible inside spherically-symmetric ejecta, because both the magnetic field lines and the charged grains velocities are radially oriented. The model does not explicitly compute the time-dependent ionization of the gas, but it assumes that the shocked gas is fully ionized and composed by H II, He III and O II, which represent the most abundant ions.
Dust reprocessing is considered following thermal and nonthermal sputtering, shattering, and vaporization in grain–grain collisions. The non-thermal sputtering term due to interactions with gas particles is described as in Bocchio et al. (2014) using the sputtering yields adopted by Nozawa et al. (2006) and Bianchi & Schneider (2007). Thermal sputtering that causes sublimation due to collisional heating to high temperatures is described as in Bianchi & Schneider (2007), and it is always found to be negligible. Shattering and vaporization in grain-grain collisions are described as in Jones et al. (1996). For a detailed description, we refer the reader to Appendices B and C of Bocchio et al. (2016).
Given the low number density of dust grains in our uniform ejecta, grain-grain collisions are rare and shattering, and vaporization is always subdominant with respect to non-thermal sputtering, which represents the dominant dust destruction processes in our model. It is important to note, however, that grain-grain collisions are important in high-density dusty clumps, as shown by Kirchschlager et al. (2019).
We apply the GRASHrev model to the grids of nonrotating and rotating SN dust yields described in the previous sections. For each SN model, we quantify the effects of the reverse shock on the mass, composition and size distribution of the ejecta dust assuming three different values for the surrounding ISM density, ρISM = 1.5 × 10⁻²⁵, 1.5 × 10⁻²⁴, and 1.5 × 10⁻²³ g cm−3, which correspond to nISM ≃ 0.05, 0.5 and 5 cm−3, for an assumed molecular weight of μ = 1.69. The resulting dust yields are labeled as rev1, rev2, and rev3, respectively. The no-rev case indicates the results described above, before the passage of the reverse shock, but could also be indicative of the expected yields if the explosions occur in a very under-dense region of the ISM (with nISM ≪ 0.05 cm−3).
The total dust mass is defined as
![Mathematical equation: $\[m_{\mathrm{dust}}=\sum_i \int_{a_{\min }}^{a_{\max }}\left(\frac{\mathrm{d} n}{\mathrm{~d} a}\right)_i \frac{4}{3} \pi a^3 \rho_i \mathrm{~d} a,\]$](/articles/aa/full_html/2026/04/aa55906-25/aa55906-25-eq2.png) (2)
(2)
where (dn/da)i is the dust size distribution of i-th grain species defined within the range of minimum size amin and maximum size amax, and ρi is the grain density of the i-th grain species. The grain densities for each specie are summarized in Bocchio et al. (2016), and the iron density is set to be 7.9 g cm−3 (Marsh 1980).
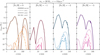 |
Fig. 3 Grain size distribution for a nonrotating progenitor with a mass of 20 M⊙. The horizontal axis represents the grain size, while the vertical axis indicates the corresponding dust mass for each size bin, which is defined as in Eq. (3), with 50 bins. From left to right, the panels show results for an initial stellar metallicity of [Fe/H] = 0, −1, −2, and −3, respectively. In each panel, the solid, dotted, dashed, and dash-dotted lines correspond to the no-reverse shock (no-rev), rev1, rev2, and rev3 models, respectively. |
5 Results
The total surviving dust mass at 106 yr after the explosion is shown as a function of the initial SN progenitor mass and metallicity for nonrotating and rotating models in Figs. 1 and 2. In each panel, the three dashed lines indicate the results of the three reverse shock (rev shock) models. Consistent with previous studies (Bianchi & Schneider 2007; Bocchio et al. 2016), we find that the destructive effect of the reverse shock increases with the ambient ISM density, nISM, with the smallest surviving dust mass typically observed in the rev3 model. Hence, the mean environmental density where the explosions occur appears to be a critical factor to assess the efficiency of interstellar dust enrichment by SNe. However, the extent of destruction caused by the reverse shock strongly depends on the initial grain size distribution, and rev3 does not always yield the lowest surviving dust mass.
As a general trend, grains formed in the ejecta of the most massive SN progenitors appear to suffer less destruction compared to less massive ones, independently of the initial metallicity and rotation rate. In the cases of nonrotating progenitors with 13 and 15 M⊙, the dust grains are almost completely destroyed by the reverse shock. This implies that – although dust is generally most efficiently synthesized in the SN ejecta of 15–25 M⊙ stars – the explosions of more massive stars may lead to larger dust enrichment if the explosions occur in a low-density region of the ISM. We find that the maximum mass of dust surviving the passage of the reverse shock is released by SN explosions with 120 M⊙ progenitors exploding in a region of the ISM with nISM = 0.5 cm−3: for the nonrotating [Fe/H] = 0 model, the surviving dust mass is mdust ≃ 0.02 M⊙ and corresponds to ≃4% of the initial dust mass formed in the ejecta. A similar surviving mass fraction (≈5%) is found for the rotating [Fe/H] = −1 model, with a final dust mass of mdust ≃ 0.03 M⊙.
It is important to note that dust is not homogeneously destroyed throughout the SN remnants. In Appendix A, we show the time evolution of the dust mass for one set of models (nonrotating, solar metallicity, rev1), and the dust density profile for a 20 M⊙ progenitor in the same set of models at some characteristic times (initial, at the end of the ejecta-dominated phase, and after the reverse shock has reached the center of the explosion and the grains move behind the forward the shock). As already discussed in Bocchio et al. (2016), the largest dust destruction occurs after 104−105 yr from the explosion, when a large fraction of grains reach regions behind the forward shock, where gas conditions are harsh and dust erosion is very efficient.
5.1 Results for nonrotating models
In Fig. 3, we present the grain size distribution for a nonrotating progenitor with a mass of 20 M⊙, in order to evaluate the impact of the reverse shock. On the vertical axis, we show the dust mass contributed by each grain size bin aj, computed as
![Mathematical equation: $\[m_{\mathrm{dust}}(a_j)=\sum_i \int_{a_j}^{a_j+\Delta a_j}\left(\frac{\mathrm{~d} n}{\mathrm{~d} a}\right)_i \frac{4}{3} \pi a^3 \rho_i \mathrm{~d} a,\]$](/articles/aa/full_html/2026/04/aa55906-25/aa55906-25-eq3.png) (3)
(3)
where Δaj is the size of the j-th bin, and we have considered 50 bins logarithmically spaced in the range [1 nm, 1000 nm] for nonrotating and rotating models.
From left to right, each panel corresponds to a different initial metallicity: [Fe/H] = 0, −1, −2, and −3. The solid, dotted, dashed, and dash-dotted lines represent the no-reverse shock (no-rev), rev1, rev2, and rev3 models, respectively.
In the no-rev models, the size distribution is bimodal, with peaks at a ≃ 10 nm and a ≃ 100 nm for [Fe/H] = 0. These peaks shift toward smaller sizes as the metallicity decreases. The larger grains are primarily composed of amorphous carbon (AC), while the smaller grain population is dominated by Fe3O4 and Mg2SiO4.
Dust grains with initial sizes a ≳ 10 nm are more resistant to the passage of the reverse shock, with AC contributing the majority of the surviving dust mass in most cases. Conversely, grains with a ≲ 10 nm are significantly destroyed by the reverse shock, despite their initially large dust mass fractions, particularly at [Fe/H] = 0, −2, and −3.
Similar results are found when analyzing other initial progenitor masses. In some cases, the distribution is not bimodal, but rather lognormal with a single broad peak. As an example, we show in Fig. 4 the grain size distribution of a 60 M⊙ progenitor with [Fe/H] = 0 (left panel) and [Fe/H] = −1 (right panel). The no-rev model with [Fe/H] = 0 has a bimodal distribution separated in a ~ 100 nm, which is composed of Fe grains with a ≲ 100 nm and AC grains with a ≳ 100 nm. After the passage of the reverse shock, the main contribution of the dust yield is AC, although the Fe grains also survive. For [Fe/H] = −1, the no-rev model is characterized by a lognormal distribution consisting of AC grains. As a result, even in this case, the main contribution to the surviving dust mass is by AC grains, with a size distribution that is shifted toward smaller grains with increasing nISM.
Fig. 5 shows the average grain size weighted by dust mass for nonrotating progenitor stars, computed as
![Mathematical equation: $\[a_{\mathrm{ave}}=\frac{\sum_j a_j m_{\mathrm{dust}}(a_j)}{m_{\mathrm{dust}}},\]$](/articles/aa/full_html/2026/04/aa55906-25/aa55906-25-eq4.png) (4)
(4)
as a function of the initial stellar progenitor mass. The solid, dotted, dashed, and dash-dotted lines correspond to no-rev, rev1, rev2, and rev3 models, respectively.
Compared to the no-rev models, the reverse shock models predict smaller average grain sizes for less massive progenitor stars, such as those with 13 M⊙ and 15 M⊙, particularly at [Fe/H] = 0 and −1. In contrast, more massive progenitor stars tend to produce larger dust grains, with average sizes aave ≳ 100 nm after the passage of the reverse shock. The larger amorphous carbon (AC) grains ejected in the no-rev models are more likely to survive the destructive effects of the reverse shock.
A general trend observed is that the average grain size decreases with increasing ambient ISM density (nISM), reflecting the enhanced destruction of larger grains. For progenitors of 13 M⊙ and 15 M⊙, the surviving dust masses are typically ≲10−6 M⊙, with most of the grains reduced to sizes around ~1 nm. This is due to the large impact that the reverse shock has on the small grains produced by these explosions, whose sizes initially range between 1 nm and 100 nm. In contrast, large dust grains (≳100 nm) are predominantly produced in the ejecta of more massive progenitors with [Fe/H] = 0, −1, and −2, after the passage of the reverse shock.
In Fig. 6, we show the surviving dust mass fraction, η, defined as the ratio of the dust mass after the passage of the reverse shock to the initial dust mass, plotted as a function of the initial mass of the progenitor star. The left and right panels correspond to progenitors with initial metallicity of [Fe/H] = 0 and −1, respectively.
We divide the surviving dust fraction into two categories: grains with sizes a < aave,no-rev (green circles) and a ≥ aave,no-rev (purple squares), where aave,no-rev represents the dust-mass-weighted average grain size for each nonrotating progenitor in the no-rev model (shown as solid lines in Fig. 5). The dotted, dashed, and dash-dotted lines correspond to the rev1, rev2, and rev3 models, respectively. Shaded areas indicate the range between the maximum and minimum surviving fractions across different ISM densities.
For [Fe/H] = 0, the surviving mass fraction of larger grains is higher than that of smaller grains in massive progenitor stars, as large amorphous carbon (AC) grains are more likely to survive the reverse shock. The maximum surviving fraction for large grains is 2.7% in the rev 2 model for the 120 M⊙ progenitor. For small grains, the highest surviving fraction is 1.8% in the rev3 model for the same progenitor.
In contrast, for [Fe/H] = −1, the mass fraction of smaller grains exceeds that of larger grains for progenitors with 40 M⊙ and 60 M⊙. We shall note here that this quantity does not reflect the fraction of pre-shock small grains that survives the reverse shock; rather, it compares the post-shock mass in small grains which also results from partial destruction of larger grains – to the initial pre-shock value.
As shown in Fig. 4, the grain size distribution at this metallicity is not bimodal, and the dust mass below and above the average grain size is roughly comparable. In these cases, the reverse shock fragments initially large grains into smaller ones, resulting in a higher fraction of small grains. For all other progenitor masses – except 13 M⊙ and 15 M⊙ – the size distributions are bimodal, and the surviving fractions for grains with a ≥ aave,no-rev exceed those for smaller grains. At [Fe/H] = −1, the maximum surviving fraction for large grains is 1.3%, observed in the rev1 model for the 80 M⊙ progenitor, while the maximum for small grains is 1.8%, also occurring in the rev1 model for the 40 M⊙ progenitor.
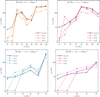 |
Fig. 5 Dust-mass-weighted average grain size as a function of the mass of the nonrotating progenitor star. |
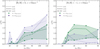 |
Fig. 6 Surviving dust mass fractions as a function of the mass of nonrotating progenitor stars. The left and right panels represent the metallicity of [Fe/H] = 0 and −1, respectively. In each panel, the dotted, dashed, and dash-dotted lines correspond to rev1, rev2, and rev3 models. The green and purple colors indicate the minimum and maximum mass fractions corresponding to grain sizes with a < aave, no-rev and a ≥ aave, no-rev, respectively. aave, no-rev is the dust-mass weighted average grain size for each nonrotating progenitor star in the no-rev model shown in Fig. 5. The symbols and shaded areas represent the minimum and maximum mass fractions for each progenitor mass. We shall note here that η can be interpreted as the true surviving fraction for large grains. For smaller grains, instead, this quantity does not reflect the fraction of pre-shock small grains that survives the reverse shock; rather, it compares the post-shock mass in small grains – which also results from partial destruction of larger grains – to the initial pre-shock value (see text). |
5.2 Results for rotating models
Figure 7 shows the grain size distribution for rotating progenitor stars with a mass of 20 M⊙. Similar to the nonrotating models, larger grains are more likely to survive the passage of the reverse shock. In the no-rev model, amorphous carbon (AC) grains dominate the larger grain population. In contrast, smaller grains are almost entirely destroyed by the reverse shock at [Fe/H] = 0.
For the rotating progenitor with [Fe/H] = −2, no dust grains are ejected after the reverse shock in environments with ISM densities of nISM = 0.5 and 5 cm−3, indicating complete destruction. However, for metallicity of [Fe/H] = −1 and −3, small MgSiO3 and Mg2SiO4 grains with sizes around ~1 nm survive in lower-density ISM conditions (nISM = 0.05 and 0.5 cm−3). Among the reverse shock models, the rev1 model shows the highest survival of large grains after the shock, compared to rev2 and rev3.
In Fig. 8, we present the average grain size – weighted by dust mass – for rotating progenitor stars. Compared to their nonrotating counterparts, the rotating models generally produce larger average grain sizes. This is particularly evident for massive progenitors, which eject grains with aave ≳ 100 nm even after the passage of the reverse shock.
In contrast, lower-mass progenitors such as those with 13 M⊙ and 15 M⊙ produce significantly smaller grains, especially at metallicity of [Fe/H] = −1, −2, and −3. The reverse shock becomes increasingly effective at reducing the size of large grains as the ambient ISM density increases, highlighting the strong dependence of dust survival on both stellar mass and environmental conditions.
Figure 9 shows the surviving dust mass fractions for the rotating progenitor models. Compared to the nonrotating cases, the surviving fractions of small grains are systematically higher for massive progenitors.
For both metallicity, [Fe/H] = 0 and −1, smaller grains exhibit higher surviving fractions than larger grains. This trend arises because the reverse shock tends to fragment larger grains, increasing the population of smaller grains. Notably, the 120 M⊙ progenitor at [Fe/H] = 0 shows a particularly high surviving fraction of small grains in both the rev1 and rev2 models. Specifically, at [Fe/H] = 0, the maximum surviving fraction of large grains is 2.0% in the rev 2 model for the 120 M⊙ progenitor, while the highest surviving fraction of small grains reaches 2.9% in the rev2 model for the 80 M⊙ progenitor.
At [Fe/H] = −1, the surviving fractions for both small and large grains remain relatively high. For the 120 M⊙ progenitor, the surviving fraction of small grains reaches at least 2.8% in the rev2 model, while large grains survive at a rate of 2.2% for the same progenitor in the rev2 model.
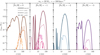 |
Fig. 7 Grain size distribution for a rotating progenitor with a mass of 20 M⊙. From left to right, the panels show results for initial stellar metallicity of [Fe/H] = 0, −1, −2, and −3, respectively. In each panel, the solid, dotted, dashed, and dash-dotted lines correspond to the no-reverse shock (no-rev), rev1, rev2, and rev3 models, respectively. |
6 Discussion
The results presented in the previous sections provide a quantitative estimate of the effective dust yields produced by massive stars, based on a homogeneous grid of supernova (SN) models spanning a range of initial stellar masses (13–120 M⊙), two initial rotation velocities (v = 0 and v = 300 km s−1), and four different initial metallicity: [Fe/H] = 0, −1, −2, and −3 (Limongi & Chieffi 2018). A key finding of our study is that only a small fraction – typically less than 10% – of the initially formed dust survives the reverse shock and is subsequently injected into the ISM. However, the exact survival yield depends sensitively on the progenitor’s mass, metallicity, rotation rate, and the local ISM density at the time of the explosion.
It is important to acknowledge the limitations of our approach. The initial grain populations used in our calculations are based on the predictions of Marassi et al. (2019), which apply classical nucleation theory within a homogeneous, spherically symmetric, uniformly mixed ejecta model. This assumption significantly simplifies the complex and inherently asymmetric nature of real SN explosions (Bruenn et al. 2016). In reality, dust nucleation likely occurs in clumpy ejecta, potentially leading to the formation of larger grains that are more resistant to destruction by the reverse shock (see Micelotta et al. 2018 and references therein). Conversely, clumpy environments can also enhance grain-grain collisions, promoting the fragmentation of grains into smaller sizes (Kirchschlager et al. 2019, 2020).
Including inhomogeneities in the ejecta structure, such as clumps, filaments, or wind-blown bubbles, is expected to significantly affect the resulting dust survival fractions. Dense clumps and filaments can either enhance dust destruction by creating localized regions of intense shock interaction or reduce it through effective shielding, depending on their mass and density. Conversely, low-density regions such as voids or wind-blown bubbles generally lead to lower dust destruction, as the reduced gas densities result in weaker shock processing. These complex effects are not captured in our current one-dimensional homogeneous model, and their potential impact should be considered when interpreting our results.
In addition, we do not consider the possibility of a delayed formation of the reverse shock, as it may be the case for the Crab nebula, where the outer reverse shock has not yet developed (Blondin et al. 2001). This may lead to a smaller destruction efficiency due to the lower gas density reached by the SN remnant by the time the reverse shock develops and travels through the ejecta.
Finally, we do not consider the possible reformation of dust in a cold, dense shell, between the forward and reverse shocks, as suggested by recent JWST observations of stripped-envelope SN explosions interacting with their dense, hydrogen rich, CSM (Shahbandeh et al. 2025; Tinyanont et al. 2025). Such secondary dust formation could contribute significantly to the overall dust budget and increase the effective mass of dust that ultimately enriches the ISM.
Despite these limitations, our findings are broadly consistent with previous studies, as discussed in Section 2, reinforcing the emerging consensus that reverse shock destruction plays a major role in regulating the efficiency of dust enrichment by core-collapse supernovae.
In our study, we have assumed that all supernovae (SNe) explode with a fixed-energy of 1.2 × 1051 ergs. However, observations indicate that SNe span a broad range of explosion energies, from faint explosions to hypernovae (Nomoto et al. 2013). In Marassi et al. (2019), an independent grid of SN models was developed and calibrated to reproduce the observed relationship between the mass of synthesized 56Ni and the progenitor mass, as shown in their Fig. 1. These calibrated energy models result in more massive and metal-rich ejecta, leading to more efficient dust production. In these models, the dust mass increases with progenitor mass and is dominated by silicate grains across all metallicity (Marassi et al. 2019).
The choice of explosion energy calibration is clearly critical, as it directly influences the location of the mass cut, and consequently, the mass and metal composition of the ejecta. Limongi & Chieffi (2018) explored the impact of such calibration choices on metal yields and proposed a recommended set of models. In their framework, all stars with initial masses in the range 13–25 M⊙ are assumed to produce a fixed amount of 56Ni (0.07 M⊙), while stars with initial masses greater than 25 M⊙ are assumed to fail in exploding and collapse directly into black holes.
Adopting this framework and restricting dust production to progenitors with m⋆ ≤ 25 M⊙ would significantly reduce the total SN dust yield compared to the results obtained using our fixed-energy SN grid, particularly for rotating progenitors.
It is important to stress that any robust estimate of the SN contribution to dust enrichment must account for the stellar initial mass function and the star formation history (see the discussion in Schneider & Maiolino 2024). We explore these aspects further in the context of early dust production at high redshift in a companion paper (Otaki et al., in prep.).
Despite the large destructive effect of the reverse shock, our results show that – on very short timescales – SNe can seed the ISM with carbonaceous grains with sizes ranging from ~1 nm to ~100 nm (~1 μm) for rotating (nonrotating) models.
This is particularly interesting in light of the recent observation of the UV extinction bump at 2175 Å in the galaxy JADES-GS-z6-0 at z = 6.71 (Markov et al. 2023; Witstok et al. 2023b; Markov et al. 2025). This bump has been generally interpreted as due to carbon nanoparticles, although Li et al. (2024) shows that the extinction bump arising from those grains is too broad and peaks at wavelengths that are too long to agree with what is seen in JADES-GS-z6-0. Conversely, Lin et al. (2025) demonstrates that the combined electronic absorption spectra for a number of polycyclic aromatic hydrocarbon (PAH) molecules closely reproduce the observed peak wavelength and width. Indeed, small amorphous carbon grains, similar to what we predict to form in SN ejecta, once injected into the ISM, could have reacted with hydrogen and shattered, producing PAHs.
7 Conclusions
We have analyzed SN dust yields and grain size distributions, including the destructive effect of the reverse shock generated by the interaction of the forward shock and the surrounding ISM using the GRASHrev model (Bocchio et al. 2016). A homogeneous grid of SN models has been considered, with initial stellar masses 13–120 M⊙, two initial rotation velocities v = 0 and 300 km s−1, four different initial metallicity [Fe/H] = 0, −1, −2, and −3 (Limongi & Chieffi 2018), assuming that the explosions have occurred in a uniform medium with densities nISM ≃ 0.05, 0.5 and 5 cm−3. This study provides the first results of effective dust yields that explore the effect of the rotation velocity of the progenitor star. The rotation-induced mixing affects the dust mass and grain size distribution before the passage of the reverse shock, resulting in the production of larger dust grains after the destructive effect of the reverse shock compared to the nonrotating models.
The results are summarized as follows:
-
Before the reverse shock, the most efficient dust producers in nonrotating models are progenitors with masses m⋆ ~ 20–25 M⊙, producing up to ~1.2 M⊙ of dust independently of their initial metallicity, except for [Fe/H] = −1. For nonrotating progenitors with low metallicity [Fe/H] = −3 and large stellar masses m⋆ > 30 M⊙, no dust is formed in SN ejecta due to the effect of fallback.
On the other hand, the effect of rotation-induced mixing leads to more metal-enriched ejecta, and up 2.2 M⊙ of dust is produced by a m⋆ = 15 M⊙, [Fe/H] = 0 rotating progenitor.
For the same progenitor mass and metallicity, the grain size distribution depends on the initial rotation velocity of the star. In general, the size distribution has a lognormal or a bimodal shape with sizes ranging from ~1 nm to ~100 nm (~1 μm) for rotating (nonrotating) models;
Depending on the initial grain size distribution, the reverse shock can significantly reduce the dust mass. The surviving fraction of the initial dust mass ranges from 0 (when the surviving dust mass is <10−6 M⊙ we effectively assume it to be zero) to a maximum of 5%. The grains formed in SN ejecta with massive stellar progenitors tend to be more resistant to destruction compared to less massive ones, independently of the initial metallicity and rotation velocity. Among nonrotating models, the maximum mass of dust surviving the passage of the reverse shock is 0.02 M⊙ for the progenitor with m⋆ = 120 M⊙ and [Fe/H] = 0 exploding in a region of the ISM with nISM = 0.5 cm−3. For the rotating models, a maximum dust mass of 0.03 M⊙ is released by the same progenitor model and assuming the same ISM density;
The grain size distribution and composition are modified by the reverse shock. As a general trend, for a given progenitor, the average grain size decreases with increasing ISM density due to the enhanced destruction of small grains. The resulting size distributions are very irregular and the effect of the reverse shock is different depending on whether the initial size distribution has a bimodal or a lognormal shape. We find that the average grain sizes increase with progenitor masses, ranging from 1 nm to 400 nm, with a non-monotonic behavior. These sizes are typically smaller for lower initial metallicity models. Rotating progenitors produce larger grains compared to nonrotating ones, after the passage of the reverse shock;
In most cases, AC grains provide the dominant contribution to the surviving dust mass. This is because in most models AC grains have initially the largest sizes and are therefore more resistant to destruction by the reverse shock, while small grains composed of other species are almost completely destroyed.
Our results indicate that the contribution of SNe to early dust enrichment significantly depends on the destruction effect of the SN reverse shock and explore for the first time the impact of the initial rotation velocity of the progenitor stars. This study provides a homogeneous set of effective dust yields that can be used to explore early dust enrichment in very high redshift galaxies and their associated extinction properties. It also shows that very small carbonaceous grains can be quickly formed and released in the ISM of high redshift galaxies, in agreement with recent JWST findings (Markov et al. 2023; Witstok et al. 2023b; Markov et al. 2025).
Data availability
Tables A.1-A.10 are available at the CDS via https://cdsarc.cds.unistra.fr/viz-bin/cat/J/A+A/708/A136. The dust yield data calculated in this paper can be found at https://github.com/K-Otaki/effective-supernova-dust-yields
Acknowledgements
On May 7, 2023, our dear friend and colleague, Dr. Stefania Marassi, passed away. She made a fundamental contribution to this work by computing all the supernova dust yields adopted in the present analysis. This paper is dedicated to her memory. KO, RS, and LG acknowledge support from the PRIN 2022 MUR project 2022CB3PJ3 – First Light And Galaxy aSsembly (FLAGS) funded by the European Union – Next Generation EU, and from EU-Recovery Fund PNRR – National Centre for HPC, Big Data and Quantum Computing. LG acknowledges support from the Amaldi Research Center funded by the MIUR program “Dipartimento di Eccellenza” (CUP:B81I18001170001). ML acknowledges partial financial contribution from the PRIN 2022 (20224MNC5A) – “Life, death and after-death of massive stars” funded by European Union–Next Generation EU and from the INAF Theory Grant “Supernova remnants as probes for the structure and mass-loss history of the progenitor systems”.
References
- Algera, H. S. B., Inami, H., Sommovigo, L., et al. 2024, MNRAS, 527, 6867 [Google Scholar]
- Asano, R. S., Takeuchi, T. T., Hirashita, H., & Nozawa, T. 2013, MNRAS, 432, 637 [NASA ADS] [CrossRef] [Google Scholar]
- Asano, R. S., Takeuchi, T. T., Hirashita, H., & Nozawa, T. 2014, MNRAS, 440, 134 [NASA ADS] [CrossRef] [Google Scholar]
- Bianchi, S., & Schneider, R. 2007, MNRAS, 378, 973 [NASA ADS] [CrossRef] [Google Scholar]
- Biscaro, C., & Cherchneff, I. 2016, A&A, 589, A132 [NASA ADS] [CrossRef] [EDP Sciences] [Google Scholar]
- Blondin, J. M., Chevalier, R. A., & Frierson, D. M. 2001, ApJ, 563, 806 [NASA ADS] [CrossRef] [Google Scholar]
- Bocchio, M., Jones, A. P., & Slavin, J. D. 2014, A&A, 570, A32 [NASA ADS] [CrossRef] [EDP Sciences] [Google Scholar]
- Bocchio, M., Marassi, S., Schneider, R., et al. 2016, A&A, 587, A157 [NASA ADS] [CrossRef] [EDP Sciences] [Google Scholar]
- Bouwens, R. J., Smit, R., Schouws, S., et al. 2022, ApJ, 931, 160 [NASA ADS] [CrossRef] [Google Scholar]
- Bowler, R. A. A., Bourne, N., Dunlop, J. S., McLure, R. J., & McLeod, D. J. 2018, MNRAS, 481, 1631 [Google Scholar]
- Brooker, E. S., Stangl, S. M., Mauney, C. M., & Fryer, C. L. 2022, ApJ, 931, 85 [NASA ADS] [CrossRef] [Google Scholar]
- Bruenn, S. W., Lentz, E. J., Hix, W. R., et al. 2016, ApJ, 818, 123 [Google Scholar]
- Calura, F., Gilli, R., Vignali, C., et al. 2014, MNRAS, 438, 2765 [NASA ADS] [CrossRef] [Google Scholar]
- Cherchneff, I., & Dwek, E. 2009, ApJ, 703, 642 [NASA ADS] [CrossRef] [Google Scholar]
- Cherchneff, I., & Dwek, E. 2010, ApJ, 713, 1 [NASA ADS] [CrossRef] [Google Scholar]
- Chiaki, G., Schneider, R., Nozawa, T., et al. 2014, MNRAS, 439, 3121 [NASA ADS] [CrossRef] [Google Scholar]
- Chiaki, G., Marassi, S., Nozawa, T., et al. 2015, MNRAS, 446, 2659 [Google Scholar]
- Chieffi, A., & Limongi, M. 2013, ApJ, 764 [Google Scholar]
- Cioffi, D. F., McKee, C. F., & Bertschinger, E. 1988, ApJ, 334, 252 [Google Scholar]
- Dayal, P., Ferrara, A., Sommovigo, L., et al. 2022, MNRAS, 512, 989 [NASA ADS] [CrossRef] [Google Scholar]
- Dell’Agli, F., García-Hernández, D. A., Rossi, C., et al. 2014, MNRAS, 441, 1115 [Google Scholar]
- Dell’Agli, F., Ventura, P., Schneider, R., et al. 2015, MNRAS, 447, 2992 [Google Scholar]
- Dell’Agli, F., García-Hernández, D. A., Ventura, P., et al. 2016, Mem. Soc. Astron. Italiana, 87, 255 [Google Scholar]
- Dell’Agli, F., García-Hernández, D. A., Schneider, R., et al. 2017, MNRAS, 467, 4431 [Google Scholar]
- Di Cesare, C., Graziani, L., Schneider, R., et al. 2023, MNRAS, 519, 4632 [Google Scholar]
- Draine, B. T. 2003, ARA&A, 41, 241 [Google Scholar]
- Dwek, E. 2005, in American Institute of Physics Conference Series, 761, The Spectral Energy Distributions of Gas-Rich Galaxies: Confronting Models with Data, eds. C. C. Popescu & R. J. Tuffs, 103 [Google Scholar]
- Ferrara, A., Sommovigo, L., Dayal, P., et al. 2022, MNRAS, 512, 58 [NASA ADS] [CrossRef] [Google Scholar]
- Ferrarotti, A. S., & Gail, H.-P. 2006, A&A, 447, 553 [CrossRef] [EDP Sciences] [Google Scholar]
- Fry, B. J., Fields, B. D., & Ellis, J. R. 2020, ApJ, 894, 109 [CrossRef] [Google Scholar]
- Ginolfi, M., Graziani, L., Schneider, R., et al. 2018, MNRAS, 473, 4538 [NASA ADS] [CrossRef] [Google Scholar]
- Glatzle, M., Ciardi, B., & Graziani, L. 2019, MNRAS, 482, 321 [NASA ADS] [CrossRef] [Google Scholar]
- Glatzle, M., Graziani, L., & Ciardi, B. 2022, MNRAS, 510, 1068 [Google Scholar]
- Graziani, L., Schneider, R., Ginolfi, M., et al. 2020, MNRAS, 494, 1071 [NASA ADS] [CrossRef] [Google Scholar]
- Hachinger, S., Mazzali, P. A., Taubenberger, S., et al. 2012, MNRAS, 422, 70 [NASA ADS] [CrossRef] [Google Scholar]
- Hashimoto, T., Laporte, N., Mawatari, K., et al. 2018, Nature, 557, 392 [NASA ADS] [CrossRef] [Google Scholar]
- Hashimoto, T., Inoue, A. K., Tamura, Y., et al. 2019, PASJ, 71, 109 [NASA ADS] [CrossRef] [Google Scholar]
- Hirashita, H. 2013, in Proceedings of The Life Cycle of Dust in the Universe: Observations, 27 [Google Scholar]
- Inami, H., Algera, H. S. B., Schouws, S., et al. 2022, MNRAS, 515, 3126 [NASA ADS] [CrossRef] [Google Scholar]
- Jones, A. P., & Nuth, J. A. 2011, A&A, 530, A44 [NASA ADS] [CrossRef] [EDP Sciences] [Google Scholar]
- Jones, A. P., Tielens, A. G. G. M., & Hollenbach, D. J. 1996, ApJ, 469, 740 [Google Scholar]
- Kirchschlager, F., Barlow, M. J., & Schmidt, F. D. 2020, ApJ, 893, 70 [CrossRef] [Google Scholar]
- Kirchschlager, F., Schmidt, F. D., Barlow, M. J., et al. 2019, MNRAS, 489, 4465 [CrossRef] [Google Scholar]
- Kirchschlager, F., Schmidt, F. D., Barlow, M. J., De Looze, I., & Sartorio, N. S. 2023, MNRAS, 520, 5042 [NASA ADS] [CrossRef] [Google Scholar]
- Kirchschlager, F., Sartorio, N. S., De Looze, I., et al. 2024, MNRAS, 528, 5364 [NASA ADS] [CrossRef] [Google Scholar]
- Knudsen, K. K., Watson, D., Frayer, D., et al. 2017, MNRAS, 466, 138 [NASA ADS] [CrossRef] [Google Scholar]
- Kozasa, T., Hasegawa, H., & Nomoto, K. 1991, A&A, 249, 474 [Google Scholar]
- Laporte, N., Ellis, R. S., Boone, F., et al. 2017, ApJ, 837, L21 [CrossRef] [Google Scholar]
- Larsson, J., Fransson, C., Sargent, B., et al. 2023, ApJ, 949, L27 [NASA ADS] [CrossRef] [Google Scholar]
- Lazzati, D., & Heger, A. 2016, ApJ, 817, 134 [Google Scholar]
- Le Fèvre, O., Béthermin, M., Faisst, A., et al. 2020, A&A, 643, A1 [Google Scholar]
- Li, Q., Yang, X. J., & Li, A. 2024, MNRAS, 535, L58 [NASA ADS] [CrossRef] [Google Scholar]
- Limongi, M., & Chieffi, A. 2018, ApJS, 237, 13 [NASA ADS] [CrossRef] [Google Scholar]
- Lin, Q., Yang, X., Li, A., & Witstok, J. 2025, A&A, 694, A84 [NASA ADS] [CrossRef] [EDP Sciences] [Google Scholar]
- Mancini, M., Schneider, R., Graziani, L., et al. 2015, MNRAS, 451, L70 [CrossRef] [Google Scholar]
- Mancini, M., Schneider, R., Graziani, L., et al. 2016, MNRAS, 462, 3130 [NASA ADS] [CrossRef] [Google Scholar]
- Marassi, S., Chiaki, G., Schneider, R., et al. 2014, ApJ, 794, 100 [NASA ADS] [CrossRef] [Google Scholar]
- Marassi, S., Schneider, R., Limongi, M., et al. 2015, MNRAS, 454, 4250 [NASA ADS] [CrossRef] [Google Scholar]
- Marassi, S., Schneider, R., Limongi, M., et al. 2019, MNRAS, 484, 2587 [NASA ADS] [CrossRef] [Google Scholar]
- Markov, V., Gallerani, S., Pallottini, A., et al. 2023, A&A, 679, A12 [NASA ADS] [CrossRef] [EDP Sciences] [Google Scholar]
- Markov, V., Gallerani, S., Ferrara, A., et al. 2025, Nat. Astron., 9, 458 [Google Scholar]
- Marrone, D. P., Spilker, J. S., Hayward, C. C., et al. 2018, Nature, 553, 51 [NASA ADS] [CrossRef] [Google Scholar]
- Marsh, S. P. 1980, LASL Shock Hugoniot Data (Berkeley: University of California Press) [Google Scholar]
- Martínez-González, S., Wünsch, R., Silich, S., et al. 2019, ApJ, 887, 198 [CrossRef] [Google Scholar]
- Martínez-González, S., Wünsch, R., Tenorio-Tagle, G., et al. 2022, ApJ, 934, 51 [Google Scholar]
- McKee, C. 1989, in IAU Symposium, 135, Interstellar Dust, eds. L. J. Allamandola, & A. G. G. M. Tielens, 431 [Google Scholar]
- Micelotta, E., & Dwek, E. 2013, in Proceedings of The Life Cycle of Dust in the Universe: Observations, 19 [Google Scholar]
- Micelotta, E. R., Dwek, E., & Slavin, J. D. 2016, A&A, 590, A65 [NASA ADS] [CrossRef] [EDP Sciences] [Google Scholar]
- Micelotta, E. R., Matsuura, M., & Sarangi, A. 2018, Space Sci. Rev., 214, 53 [NASA ADS] [CrossRef] [Google Scholar]
- Michałowski, M. J. 2015, A&A, 577, A80 [NASA ADS] [CrossRef] [EDP Sciences] [Google Scholar]
- Nanni, A., Bressan, A., Marigo, P., & Girardi, L. 2013, MNRAS, 434, 2390 [NASA ADS] [CrossRef] [Google Scholar]
- Nanni, A., Bressan, A., Marigo, P., & Girardi, L. 2014, MNRAS, 438, 2328 [NASA ADS] [CrossRef] [Google Scholar]
- Nanni, A., Bressan, A., Marigo, P., et al. 2015, in Astronomical Society of the Pacific Conference Series, 497, Why Galaxies Care about AGB Stars III: A Closer Look in Space and Time, eds. F. Kerschbaum, R. F. Wing, & J. Hron, 357 [Google Scholar]
- Nanni, A., Marigo, P., Groenewegen, M. A. T., et al. 2016, MNRAS, 462, 1215 [NASA ADS] [CrossRef] [Google Scholar]
- Nath, B. B., Laskar, T., & Shull, J. M. 2008, ApJ, 682, 1055 [NASA ADS] [CrossRef] [Google Scholar]
- Nomoto, K., Kobayashi, C., & Tominaga, N. 2013, ARA&A, 51, 457 [Google Scholar]
- Nozawa, T., Kozasa, T., Umeda, H., Maeda, K., & Nomoto, K. 2003, ApJ, 598, 785 [NASA ADS] [CrossRef] [Google Scholar]
- Nozawa, T., Kozasa, T., & Habe, A. 2006, ApJ, 648, 435 [NASA ADS] [CrossRef] [Google Scholar]
- Nozawa, T., Kozasa, T., Habe, A., et al. 2007, ApJ, 666, 955 [NASA ADS] [CrossRef] [Google Scholar]
- Nozawa, T., Kozasa, T., Tominaga, N., et al. 2010, ApJ, 713, 356 [NASA ADS] [CrossRef] [Google Scholar]
- Omukai, K., Tsuribe, T., Schneider, R., & Ferrara, A. 2005, ApJ, 626, 627 [NASA ADS] [CrossRef] [Google Scholar]
- Palla, M., De Looze, I., Relaño, M., et al. 2024, MNRAS, 528, 2407 [NASA ADS] [CrossRef] [Google Scholar]
- Popping, G., Somerville, R. S., & Galametz, M. 2017, MNRAS, 471, 3152 [NASA ADS] [CrossRef] [Google Scholar]
- Pozzi, F., Calura, F., Fudamoto, Y., et al. 2021, A&A, 653, A84 [NASA ADS] [CrossRef] [EDP Sciences] [Google Scholar]
- Rowlands, K., Gomez, H. L., Dunne, L., et al. 2014, MNRAS, 441, 1040 [Google Scholar]
- Sarangi, A., & Cherchneff, I. 2013, ApJ, 776, 107 [NASA ADS] [CrossRef] [Google Scholar]
- Sarangi, A., & Cherchneff, I. 2015, A&A, 575, A95 [NASA ADS] [CrossRef] [EDP Sciences] [Google Scholar]
- Schneider, R., & Maiolino, R. 2024, A&A Rev., 32, 2 [Google Scholar]
- Schneider, R., Ferrara, A., Salvaterra, R., Omukai, K., & Bromm, V. 2003, Nature, 422, 869 [NASA ADS] [CrossRef] [Google Scholar]
- Schneider, R., Ferrara, A., & Salvaterra, R. 2004, MNRAS, 351, 1379 [Google Scholar]
- Schneider, R., Omukai, K., Bianchi, S., & Valiante, R. 2012a, MNRAS, 419, 1566 [CrossRef] [Google Scholar]
- Schneider, R., Omukai, K., Limongi, M., et al. 2012b, MNRAS, 423, L60 [NASA ADS] [CrossRef] [Google Scholar]
- Schneider, R., Hunt, L., & Valiante, R. 2016, MNRAS, 457, 1842 [NASA ADS] [CrossRef] [Google Scholar]
- Schneider, R., Salvaterra, R., Ferrara, A., & Ciardi, B. 2006, MNRAS, 369, 825 [NASA ADS] [CrossRef] [Google Scholar]
- Schneider, R., Valiante, R., Ventura, P., et al. 2014, MNRAS, 442, 1440 [NASA ADS] [CrossRef] [Google Scholar]
- Serrano-Hernández, D. B., Martínez-González, S., Jiménez, S., Silich, S., & Wünsch, R. 2025, A&A, 695, A271 [NASA ADS] [CrossRef] [EDP Sciences] [Google Scholar]
- Shahbandeh, M., Fox, O. D., Temim, T., et al. 2025, ApJ, 985, 262 [Google Scholar]
- Silvia, D. W., Smith, B. D., & Shull, J. M. 2010, ApJ, 715, 1575 [NASA ADS] [CrossRef] [Google Scholar]
- Silvia, D. W., Smith, B. D., & Shull, J. M. 2012, ApJ, 748, 12 [NASA ADS] [CrossRef] [Google Scholar]
- Slavin, J. D., Dwek, E., & Jones, A. P. 2015, ApJ, 803, 7 [NASA ADS] [CrossRef] [Google Scholar]
- Slavin, J. D., Dwek, E., Mac Low, M.-M., & Hill, A. S. 2020, ApJ, 902, 135 [NASA ADS] [CrossRef] [Google Scholar]
- Sluder, A., Milosavljević, M., & Montgomery, M. H. 2018, MNRAS, 480, 5580 [NASA ADS] [Google Scholar]
- Sommovigo, L., Ferrara, A., Carniani, S., et al. 2022, MNRAS, 517, 5930 [NASA ADS] [CrossRef] [Google Scholar]
- Stahler, S. W., & Palla, F. 2005, The Formation of Stars (Wiley) [Google Scholar]
- Tamura, Y., Mawatari, K., Hashimoto, T., et al. 2019, ApJ, 874, 27 [NASA ADS] [CrossRef] [Google Scholar]
- Tinyanont, S., Fox, O. D., Shahbandeh, M., et al. 2025, ApJ, 985, 198 [Google Scholar]
- Todini, P., & Ferrara, A. 2001, MNRAS, 325, 726 [NASA ADS] [CrossRef] [Google Scholar]
- Truelove, J. K., & McKee, C. F. 1999, ApJS, 120, 299 [Google Scholar]
- Valiante, R., Schneider, R., Bianchi, S., & Andersen, A. C. 2009, MNRAS, 397, 1661 [CrossRef] [Google Scholar]
- Valiante, R., Schneider, R., Salvadori, S., & Gallerani, S. 2014, MNRAS, 444, 2442 [NASA ADS] [CrossRef] [Google Scholar]
- Vasiliev, E. O., & Shchekinov, Y. A. 2024, MNRAS, 527, 8755 [Google Scholar]
- Venemans, B. P., Decarli, R., Walter, F., et al. 2018, ApJ, 866, 159 [Google Scholar]
- Ventura, P., di Criscienzo, M., Schneider, R., et al. 2012a, MNRAS, 424, 2345 [NASA ADS] [CrossRef] [Google Scholar]
- Ventura, P., di Criscienzo, M., Schneider, R., et al. 2012b, MNRAS, 420, 1442 [Google Scholar]
- Ventura, P., Dell’Agli, F., Schneider, R., et al. 2014, MNRAS, 439, 977 [NASA ADS] [CrossRef] [Google Scholar]
- Ventura, P., Karakas, A., Dell’Agli, F., García-Hernández, D. A., & GuzmanRamirez, L. 2018, MNRAS, 475, 2282 [NASA ADS] [Google Scholar]
- Vijayan, A. P., Clay, S. J., Thomas, P. A., et al. 2019, MNRAS, 489, 4072 [NASA ADS] [CrossRef] [Google Scholar]
- Watson, D., Christensen, L., Knudsen, K. K., et al. 2015, Nature, 519, 327 [Google Scholar]
- Weingartner, J. C., & Draine, B. T. 1999, ApJ, 517, 292 [NASA ADS] [CrossRef] [Google Scholar]
- Witstok, J., Jones, G. C., Maiolino, R., Smit, R., & Schneider, R. 2023a, MNRAS, 523, 3119 [NASA ADS] [CrossRef] [Google Scholar]
- Witstok, J., Shivaei, I., Smit, R., et al. 2023b, Nature, 621, 267 [CrossRef] [Google Scholar]
- Wolfire, M. G., McKee, C. F., Hollenbach, D., & Tielens, A. G. G. M. 2003, ApJ, 587, 278 [Google Scholar]
- Zhukovska, S., Gail, H.-P., & Trieloff, M. 2008, A&A, 479, 453 [NASA ADS] [CrossRef] [EDP Sciences] [Google Scholar]
- Zhukovska, S., Dobbs, C., Jenkins, E. B., & Klessen, R. S. 2016, ApJ, 831, 147 [NASA ADS] [CrossRef] [Google Scholar]
- Zhukovska, S., Henning, T., & Dobbs, C. 2018, ApJ, 857, 94 [Google Scholar]
We follow Hachinger et al. (2012) and classify the SN as IIP, IIb, or Ib depending on the H and He envelope masses in the pre-SN phase (Marassi et al. 2019).
Appendix A Time evolution of dust mass
In the GRASHrev model, the initial dust densities are assumed to be uniformly distributed within the ejecta, and the dust grains are processed by the reverse shock. Fig. A.1 shows the density profiles in the rev1 model of the nonrotating progenitor with 20 M⊙ and [Fe/H] = 0 at 200 yr (top), 1.2 × 10⁴ yr (middle), and 2.9 × 10⁴ yr (bottom) after the SN explosion. The blue, red, green, and orange lines correspond to Fe3O4, AC, Mg2SiO4, and Al2O3, respectively. The vertical black dashed and dotted lines represent the positions of forward and reverse shocks, which are derived by the analytic self-similar solution by Truelove & McKee (1999) (see also Fig. 1 in Bocchio et al. 2016).
The ejecta expand adiabatically causing the dust density to decrease over time. At 200 yr after the explosion, the forward and reverse shocks are located at 0.73 pc, and 0.66 pc, respectively. During the Sedov-Taylor phase, the reverse shock reaches the maximum radius of 14 pc at 1.2 × 10⁴ yr and then begins to propagate back toward the center of the ejecta. In regions where the reverse shock has already passed, the density increases, and grain destruction occurs. By 2.9 × 10⁴ yr, the dust grains have decoupled from the gas and are partly destroyed by the reverse shock, which has by then reached the center of the explosion. Afterward, the surviving dust grains move into regions behind the forward shock, where erosion by the shocked gas is very effective.
Fig. A.2 shows the evolution of the total dust mass in the rev 1 model of nonrotating progenitors with [Fe/H] = 0. The red line indicates the initial masses, while the green and blue lines correspond to 1.2 × 10⁴ yr and 2.9 × 10⁴ yr after the SN explosion, respectively. For a 20 M⊙ progenitor, these timescales correspond to when the reverse shock reaches its maximum radius and when it arrives at the center of the explosion (see Fig. A.1). We note, however, that these timescales depend on the progenitor model and are longer for massive progenitor stars. In general, dust masses decrease monotonically as the reverse shock propagates through the ejecta. At 2.9 × 10⁴ yr, the maximum and minimum surviving dust mass fractions are 25% for a 120 M⊙ progenitor, and 0.77% for a 15 M⊙ progenitor. By 106 yr, the decoupled dust grains have moved into regions behind the forward shock, where they undergo efficient erosion, resulting in the final dust masses shown in Fig. 1 and Table A.3.
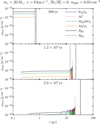 |
Fig. A.1 Dust density profile in the SN ejecta of the 20 M⊙ nonrotating progenitor with [Fe/H] = 0 within the ISM density of 0.05 cm−3. From top to bottom, each panel corresponds to the time of 200 yr, 1.2 × 10⁴ yr, and 2.9 × 10⁴ yr from the SN explosion. The blue, red, green, and orange lines represent FeO4, AC, Mg2SiO4, and Al2O3 grains. The vertical dashed and dotted lines indicate the positions of forward and reverse shocks. |
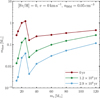 |
Fig. A.2 Dust mass as a function of the mass of nonrotating progenitor stars with [Fe/H] = 0 at 0 yr (red), 1.2 × 10⁴ yr (green), and 2.9 × 10⁴ yr (blue) from SN explosion. |
All Figures
|
Fig. 1 Dust mass in SN ejecta as a function of the initial mass of nonrotating progenitor stars. Each panel corresponds to a different metallicity: [Fe/H] = 0 (top left), [Fe/H] = −1 (top right), [Fe/H] = −2 (bottom left), and [Fe/H] = −3 (bottom right). The solid, dotted, dashed, and dash-dotted lines represent no-rev, rev1, rev2, and rev3 models in each panel. |
| In the text | |
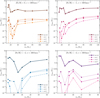 |
Fig. 2 Same as Fig. 1, but for rotating progenitor stars. |
| In the text | |
|
Fig. 3 Grain size distribution for a nonrotating progenitor with a mass of 20 M⊙. The horizontal axis represents the grain size, while the vertical axis indicates the corresponding dust mass for each size bin, which is defined as in Eq. (3), with 50 bins. From left to right, the panels show results for an initial stellar metallicity of [Fe/H] = 0, −1, −2, and −3, respectively. In each panel, the solid, dotted, dashed, and dash-dotted lines correspond to the no-reverse shock (no-rev), rev1, rev2, and rev3 models, respectively. |
| In the text | |
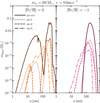 |
Fig. 4 Same as Fig. 3, but the progenitor mass is 60 M⊙. |
| In the text | |
|
Fig. 5 Dust-mass-weighted average grain size as a function of the mass of the nonrotating progenitor star. |
| In the text | |
|
Fig. 6 Surviving dust mass fractions as a function of the mass of nonrotating progenitor stars. The left and right panels represent the metallicity of [Fe/H] = 0 and −1, respectively. In each panel, the dotted, dashed, and dash-dotted lines correspond to rev1, rev2, and rev3 models. The green and purple colors indicate the minimum and maximum mass fractions corresponding to grain sizes with a < aave, no-rev and a ≥ aave, no-rev, respectively. aave, no-rev is the dust-mass weighted average grain size for each nonrotating progenitor star in the no-rev model shown in Fig. 5. The symbols and shaded areas represent the minimum and maximum mass fractions for each progenitor mass. We shall note here that η can be interpreted as the true surviving fraction for large grains. For smaller grains, instead, this quantity does not reflect the fraction of pre-shock small grains that survives the reverse shock; rather, it compares the post-shock mass in small grains – which also results from partial destruction of larger grains – to the initial pre-shock value (see text). |
| In the text | |
|
Fig. 7 Grain size distribution for a rotating progenitor with a mass of 20 M⊙. From left to right, the panels show results for initial stellar metallicity of [Fe/H] = 0, −1, −2, and −3, respectively. In each panel, the solid, dotted, dashed, and dash-dotted lines correspond to the no-reverse shock (no-rev), rev1, rev2, and rev3 models, respectively. |
| In the text | |
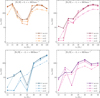 |
Fig. 8 Same as Fig. 5, but for rotating progenitor stars. |
| In the text | |
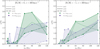 |
Fig. 9 Same as Fig. 6, but for rotating models. |
| In the text | |
|
Fig. A.1 Dust density profile in the SN ejecta of the 20 M⊙ nonrotating progenitor with [Fe/H] = 0 within the ISM density of 0.05 cm−3. From top to bottom, each panel corresponds to the time of 200 yr, 1.2 × 10⁴ yr, and 2.9 × 10⁴ yr from the SN explosion. The blue, red, green, and orange lines represent FeO4, AC, Mg2SiO4, and Al2O3 grains. The vertical dashed and dotted lines indicate the positions of forward and reverse shocks. |
| In the text | |
|
Fig. A.2 Dust mass as a function of the mass of nonrotating progenitor stars with [Fe/H] = 0 at 0 yr (red), 1.2 × 10⁴ yr (green), and 2.9 × 10⁴ yr (blue) from SN explosion. |
| In the text | |
Current usage metrics show cumulative count of Article Views (full-text article views including HTML views, PDF and ePub downloads, according to the available data) and Abstracts Views on Vision4Press platform.
Data correspond to usage on the plateform after 2015. The current usage metrics is available 48-96 hours after online publication and is updated daily on week days.
Initial download of the metrics may take a while.