Fig. 6
Download original image
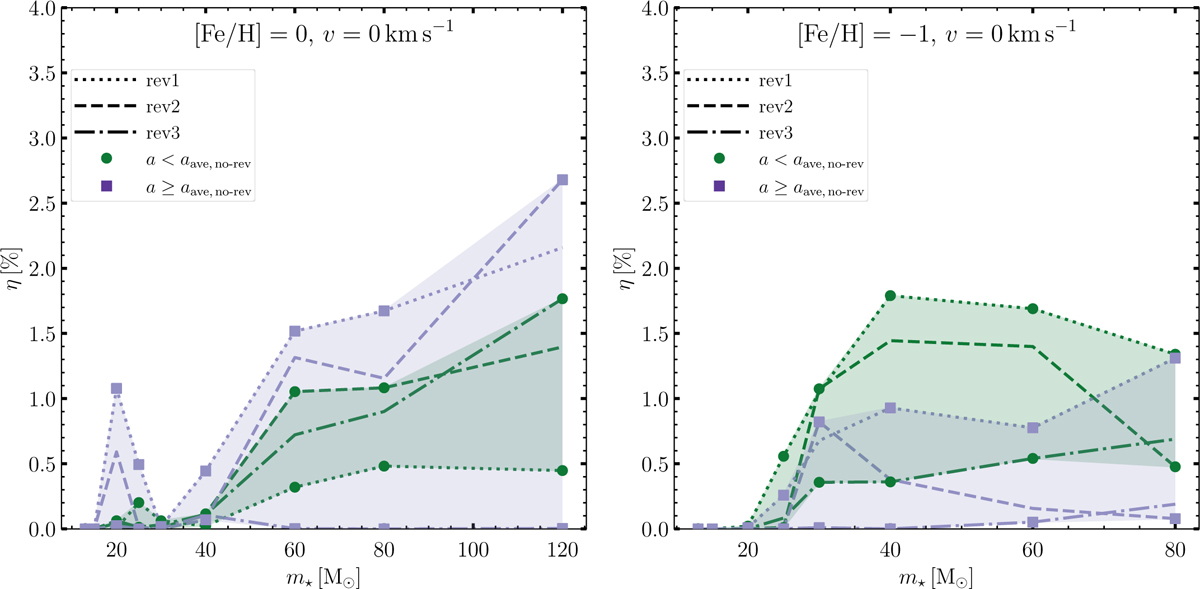
Surviving dust mass fractions as a function of the mass of nonrotating progenitor stars. The left and right panels represent the metallicity of [Fe/H] = 0 and −1, respectively. In each panel, the dotted, dashed, and dash-dotted lines correspond to rev1, rev2, and rev3 models. The green and purple colors indicate the minimum and maximum mass fractions corresponding to grain sizes with a < aave, no-rev and a ≥ aave, no-rev, respectively. aave, no-rev is the dust-mass weighted average grain size for each nonrotating progenitor star in the no-rev model shown in Fig. 5. The symbols and shaded areas represent the minimum and maximum mass fractions for each progenitor mass. We shall note here that η can be interpreted as the true surviving fraction for large grains. For smaller grains, instead, this quantity does not reflect the fraction of pre-shock small grains that survives the reverse shock; rather, it compares the post-shock mass in small grains – which also results from partial destruction of larger grains – to the initial pre-shock value (see text).
Current usage metrics show cumulative count of Article Views (full-text article views including HTML views, PDF and ePub downloads, according to the available data) and Abstracts Views on Vision4Press platform.
Data correspond to usage on the plateform after 2015. The current usage metrics is available 48-96 hours after online publication and is updated daily on week days.
Initial download of the metrics may take a while.