Fig. 1
Download original image
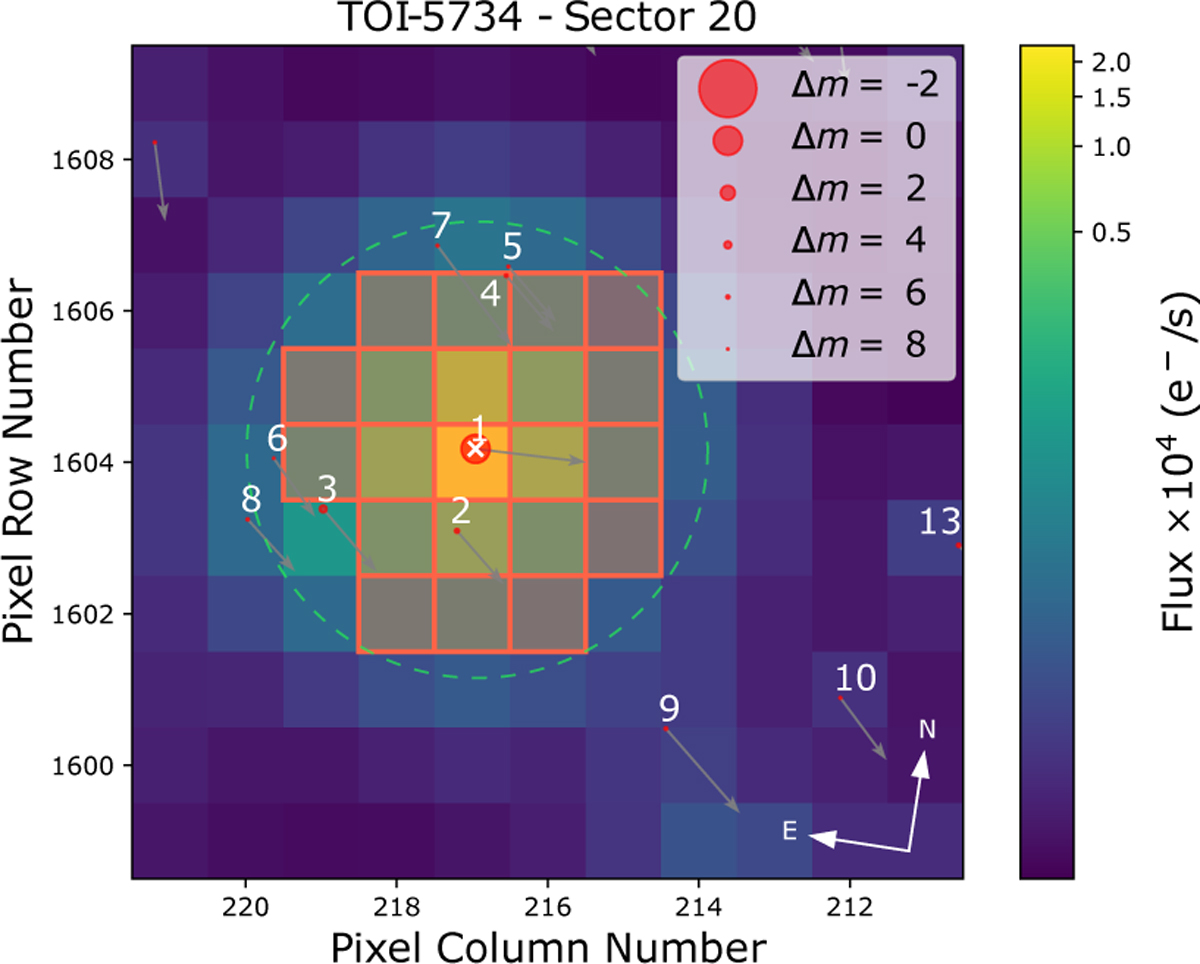
TESS target pixel file of Sector 20 of TOI-5734, which is marked with ‘1’. The other sources, extracted from the Gaia DR3 catalogue, have numbered circles of sizes proportional to the G-mag difference with our target. The colour bar shows the electron counts for each pixel. The orange squares represent the pixels used to construct the aperture photometry by the TESS pipeline. Grey arrows indicate the direction of the proper motions for all the plotted sources. The dashed green circle represents the reference three-pixel aperture to select the targets relevant for the dilution factor estimate.
Current usage metrics show cumulative count of Article Views (full-text article views including HTML views, PDF and ePub downloads, according to the available data) and Abstracts Views on Vision4Press platform.
Data correspond to usage on the plateform after 2015. The current usage metrics is available 48-96 hours after online publication and is updated daily on week days.
Initial download of the metrics may take a while.