Open Access
Fig. E.2
Download original image
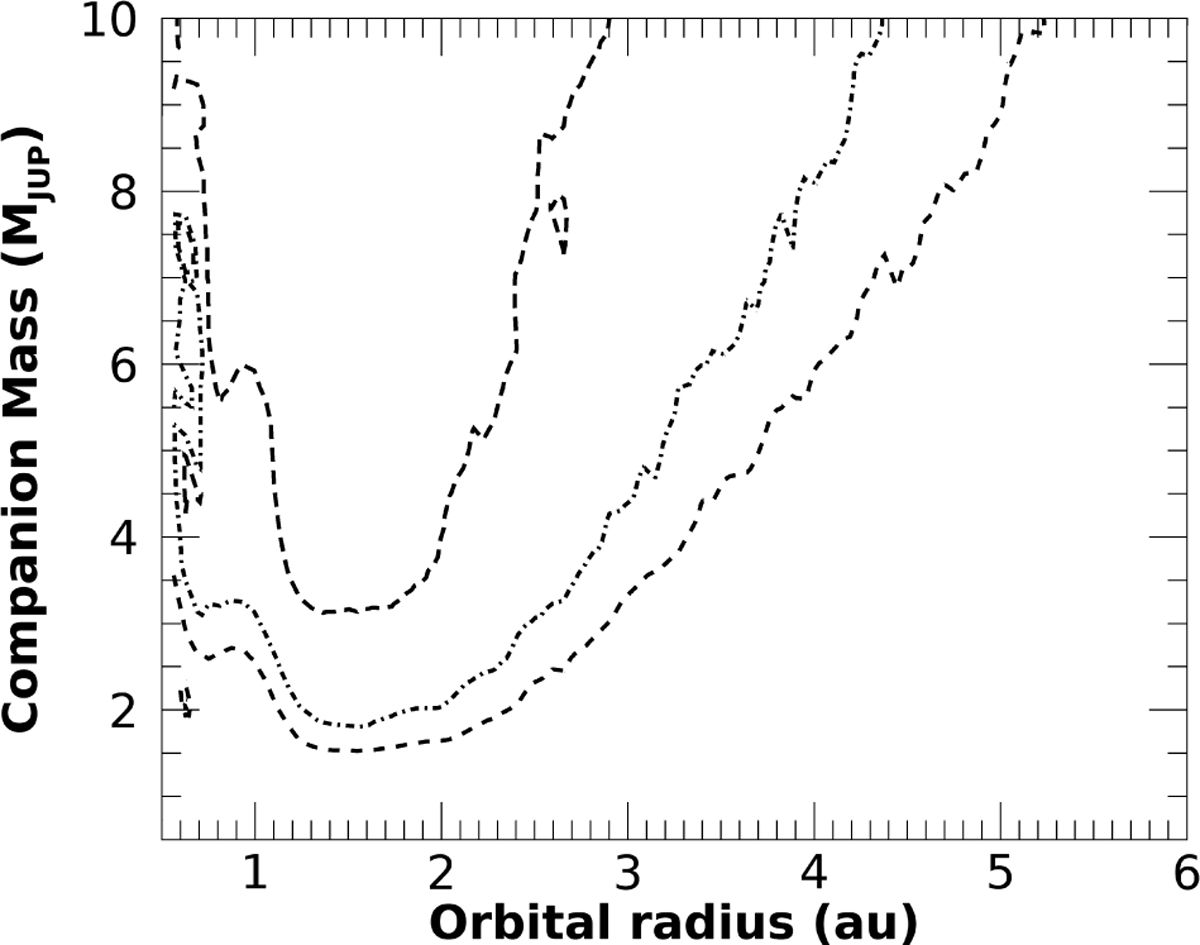
Sensitivity of Gaia DR3 astrometry. The plot of companion mass vs. orbital radius is based on simulations of planetary signals that would have produced a RUWE value in excess with respect to the one reported in the Gaia DR3 archive. Dashed contours represent the 80%, 90%, and 99% probability, from the outer to the inner.
Current usage metrics show cumulative count of Article Views (full-text article views including HTML views, PDF and ePub downloads, according to the available data) and Abstracts Views on Vision4Press platform.
Data correspond to usage on the plateform after 2015. The current usage metrics is available 48-96 hours after online publication and is updated daily on week days.
Initial download of the metrics may take a while.