Fig. 3
Download original image
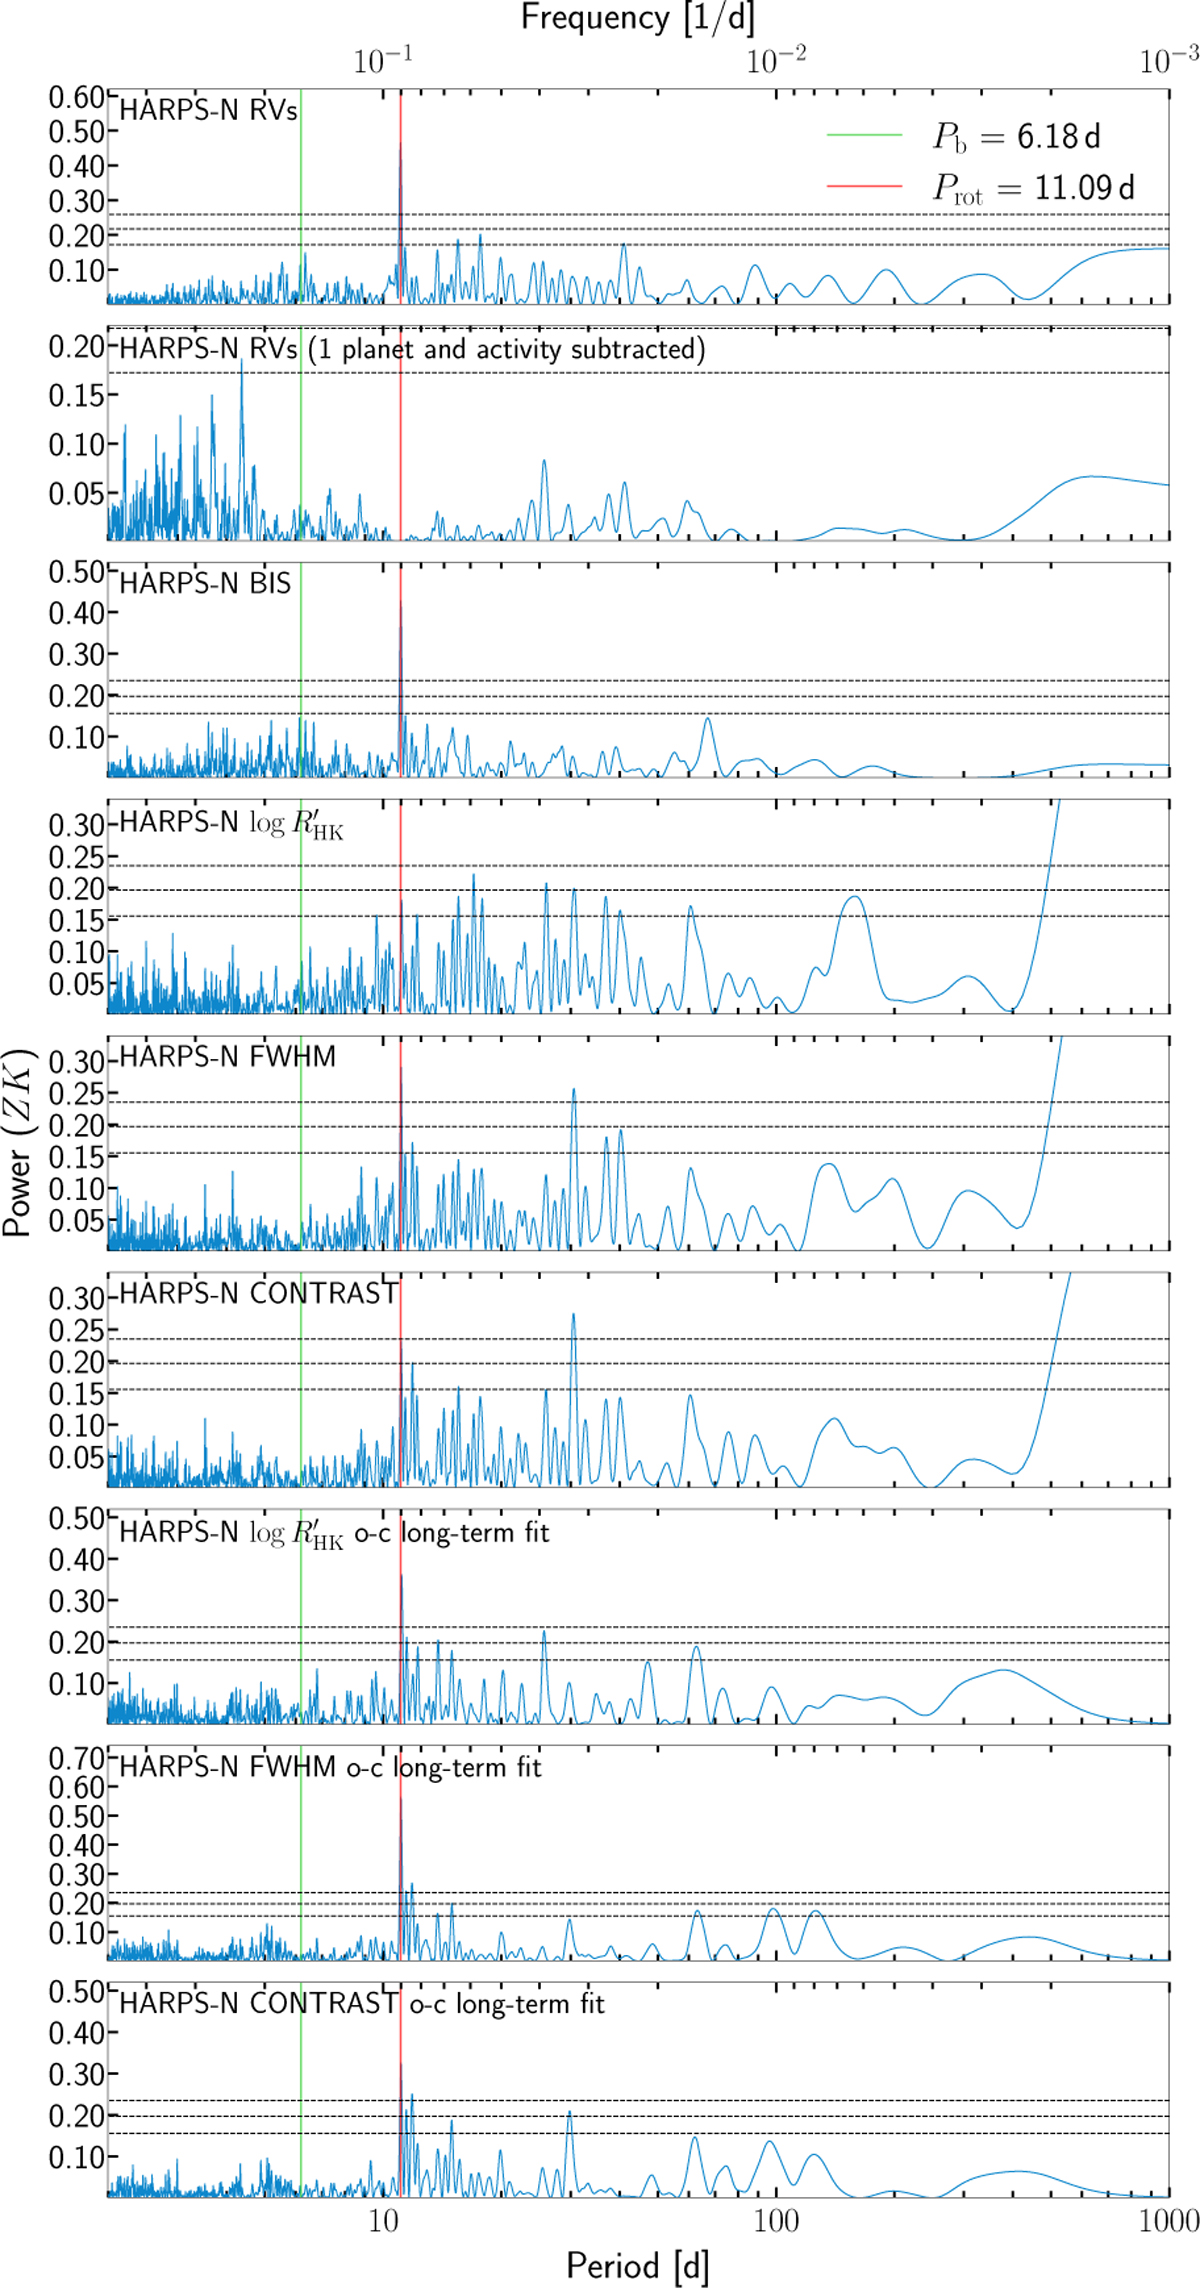
GLS power spectrum for TOI-5734 based on HARPS-N RVs, stellar activity indicators (BIS span, ![]() , FWHM, contrast), and their residuals after removing the long-term trend. The horizontal lines in the GLS periodograms indicate the FAP levels at 10%, 1%, and 0.1% power. The vertical green and red lines, respectively, highlight the positions of the planetary orbital period and stellar rotation period.
, FWHM, contrast), and their residuals after removing the long-term trend. The horizontal lines in the GLS periodograms indicate the FAP levels at 10%, 1%, and 0.1% power. The vertical green and red lines, respectively, highlight the positions of the planetary orbital period and stellar rotation period.
Current usage metrics show cumulative count of Article Views (full-text article views including HTML views, PDF and ePub downloads, according to the available data) and Abstracts Views on Vision4Press platform.
Data correspond to usage on the plateform after 2015. The current usage metrics is available 48-96 hours after online publication and is updated daily on week days.
Initial download of the metrics may take a while.