Fig. 5
Download original image
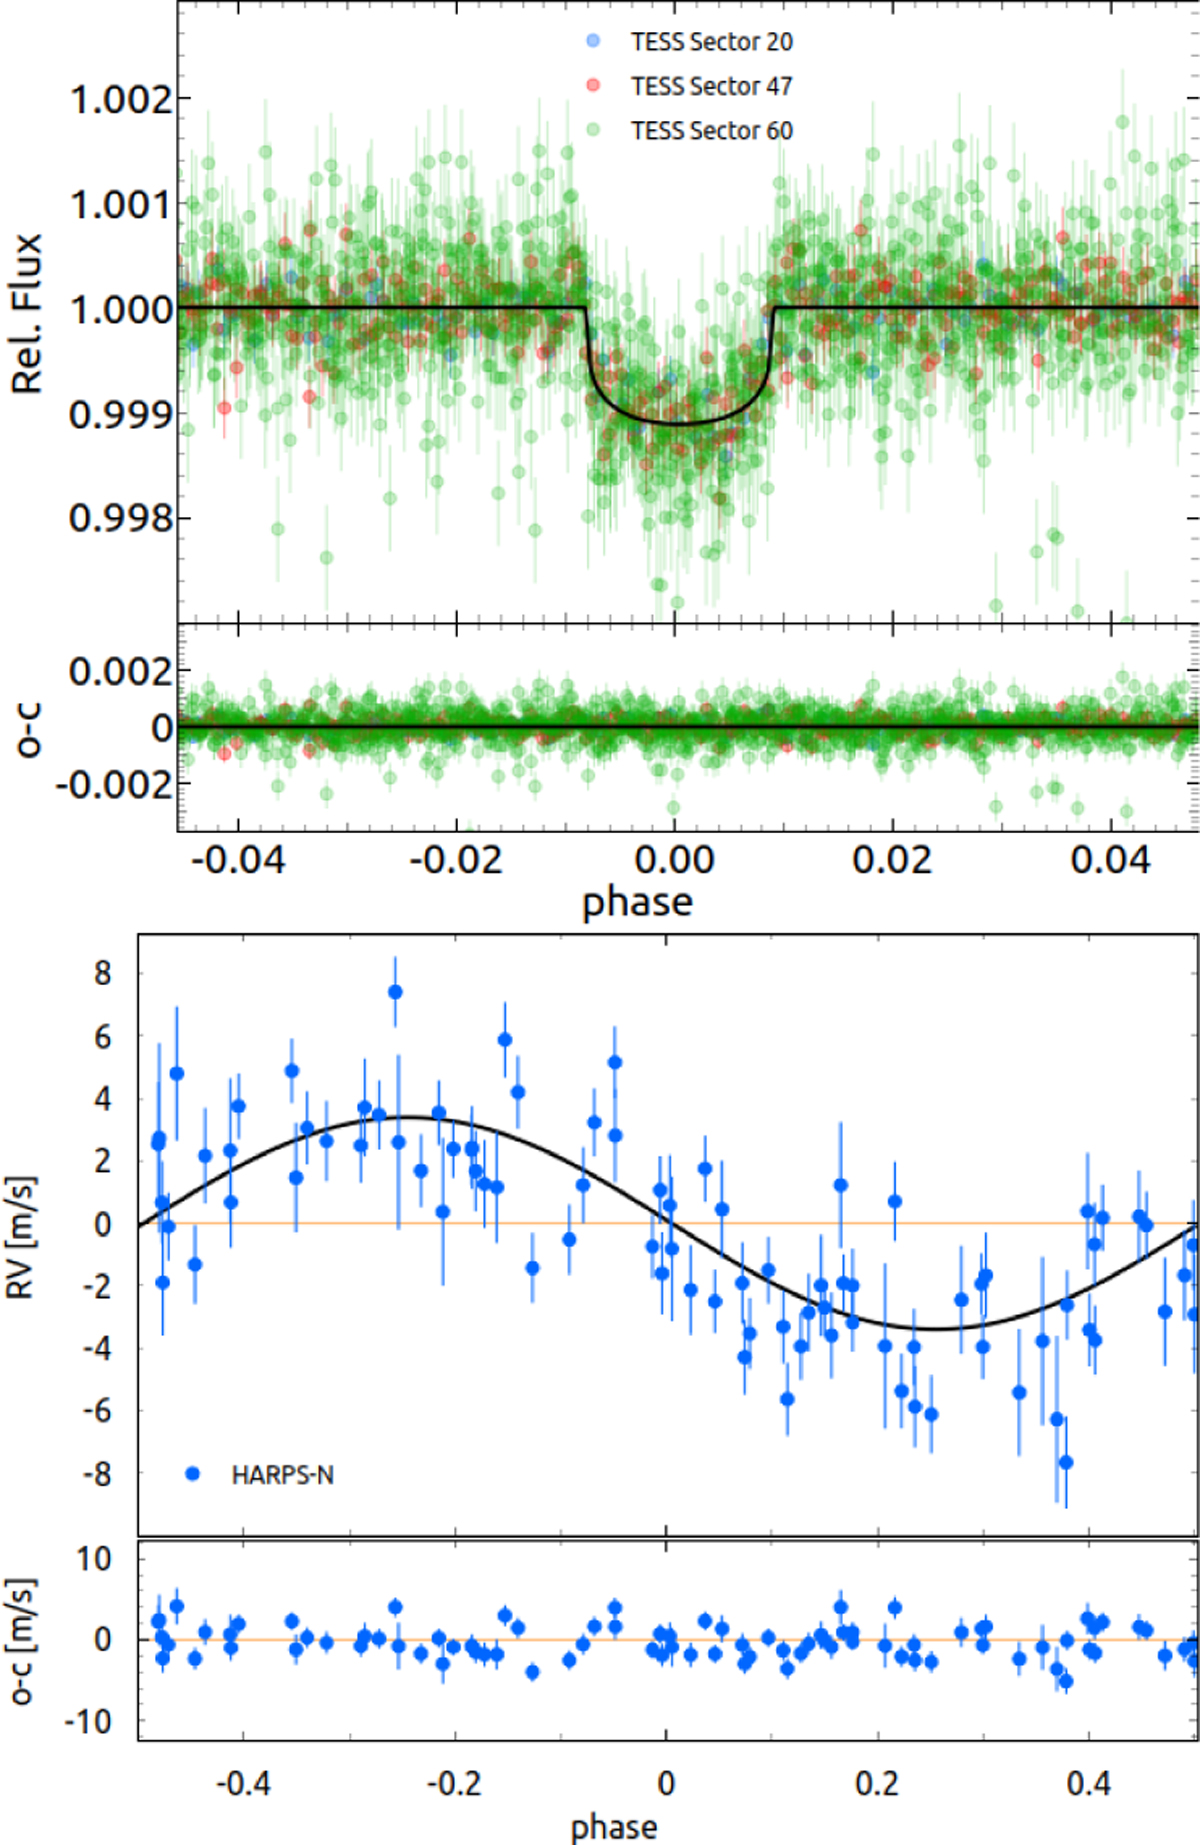
Top: TESS phase-folded transits after subtracting the GP-modelled activity, along with the transit model shown with a black line and the residuals below it. Bottom: HARPS-N phased curve of RV data after subtracting the GP-modelled activity, with the planetary RV model (black line) and the residuals plotted below. The RV error bars are plotted without the jitter, the value of which is reported in Table A.2.
Current usage metrics show cumulative count of Article Views (full-text article views including HTML views, PDF and ePub downloads, according to the available data) and Abstracts Views on Vision4Press platform.
Data correspond to usage on the plateform after 2015. The current usage metrics is available 48-96 hours after online publication and is updated daily on week days.
Initial download of the metrics may take a while.