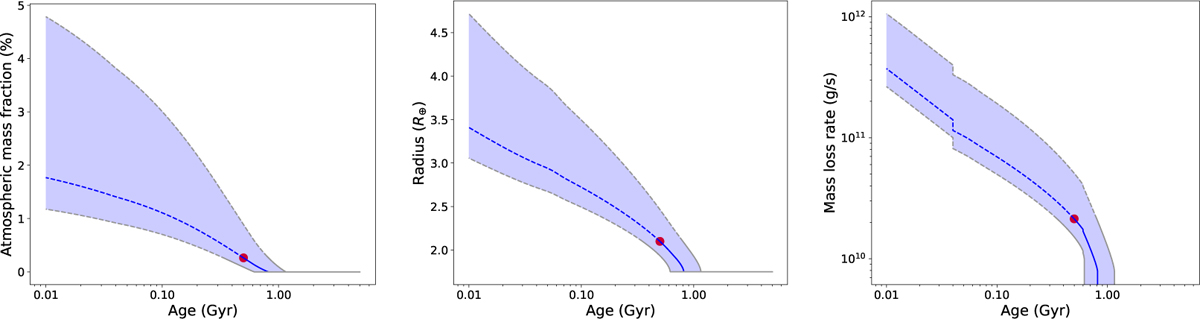
Fig. 7
Download original image
Temporal evolution of mass fraction, radius, and mass-loss rate of TOI-5734b. The panels show the evolution of atmospheric mass fraction (left), radius (middle), and mass-loss rate (right). Solid lines represent the future evolution, whereas dashed lines represent the past one. The grey lines represent the temporal evolution, considering an age equal to ±1σ the nominal age. The red circle shows the position of TOI-5734b at the current age.
Current usage metrics show cumulative count of Article Views (full-text article views including HTML views, PDF and ePub downloads, according to the available data) and Abstracts Views on Vision4Press platform.
Data correspond to usage on the plateform after 2015. The current usage metrics is available 48-96 hours after online publication and is updated daily on week days.
Initial download of the metrics may take a while.