Fig. 11
Download original image
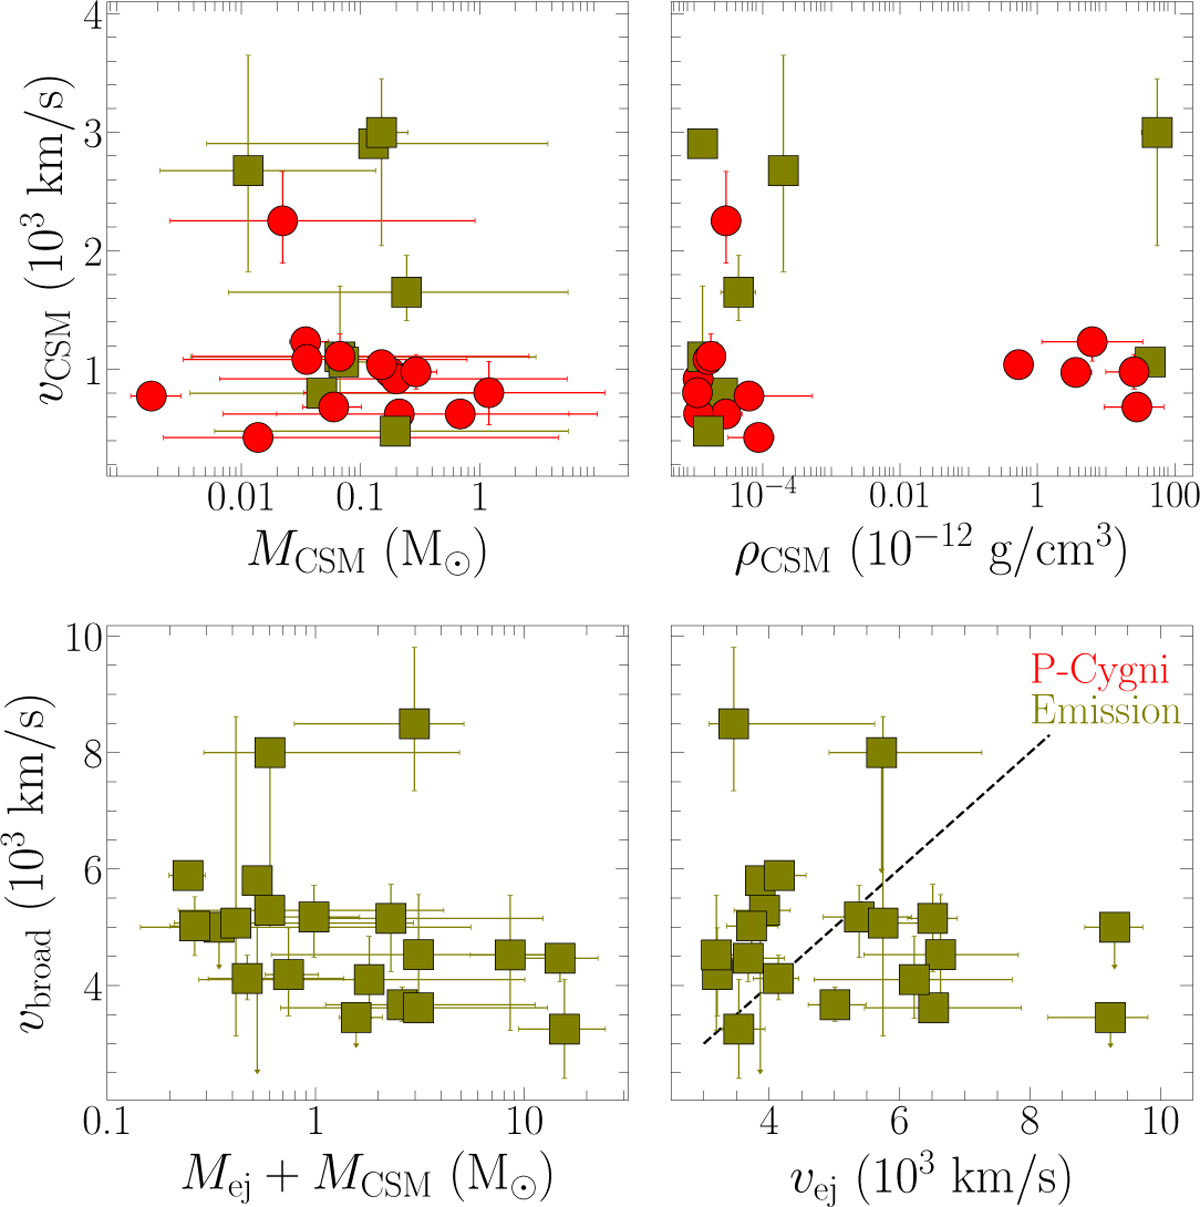
Top-left: velocity of the CSM versus the CSM mass retrieved from the CSI modeling of 24 SNe Ibn of the MOSFiT sample. The velocity of the CSM is estimated either from the minimum of the absorption component of the P-Cygni profile (red circles) or the FWHM of the emission component (olive squares) of He I λ5876 Å line. Top-right: similar to to the top-left panel, showing the velocity of the CSM versus the CSM density. Bottom-left: broadest velocity component of the He I λ5876 Å line through the entire spectroscopic evolution versus the sum of the CSM and ejecta masses from MOSFiT CSI modeling. Bottom-right: similar to the bottom-left panel, showing the broadest velocity component of He I λ5876 Å line versus the ejecta velocity from MOSFiT CSI modeling.
Current usage metrics show cumulative count of Article Views (full-text article views including HTML views, PDF and ePub downloads, according to the available data) and Abstracts Views on Vision4Press platform.
Data correspond to usage on the plateform after 2015. The current usage metrics is available 48-96 hours after online publication and is updated daily on week days.
Initial download of the metrics may take a while.