Fig. A.2
Download original image
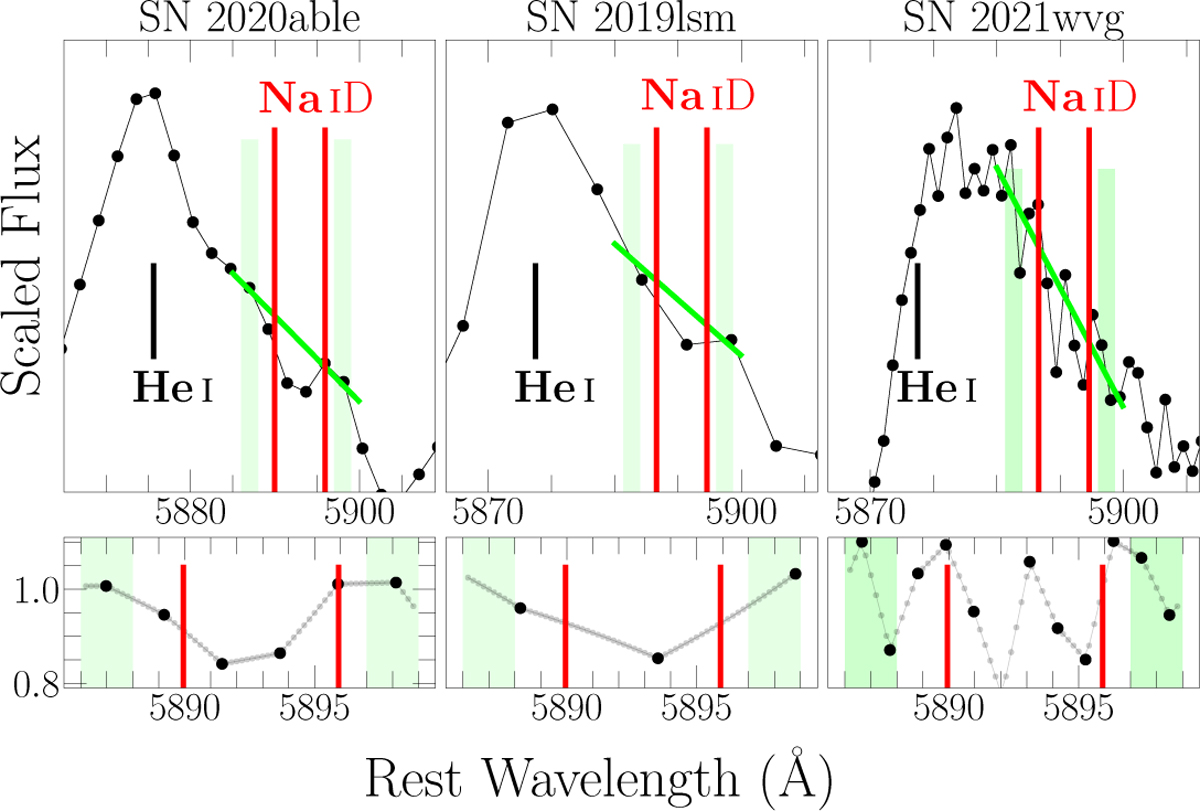
Top: Spectral region surrounding the potential Na I D lines (red, vertical lines) in the spectra of SNe 2020able (left), 20191sm (middle), and 2021wvg (right). Transparent, lime regions correspond to the background to estimate the local, linear continuum (lime, solid line). The location of the He I λ5876 Å is also shown in the panels. Bottom: Zoom-in on the normalized-by-continuum spectral regions presented in at the top.
Current usage metrics show cumulative count of Article Views (full-text article views including HTML views, PDF and ePub downloads, according to the available data) and Abstracts Views on Vision4Press platform.
Data correspond to usage on the plateform after 2015. The current usage metrics is available 48-96 hours after online publication and is updated daily on week days.
Initial download of the metrics may take a while.