Fig. 2
Download original image
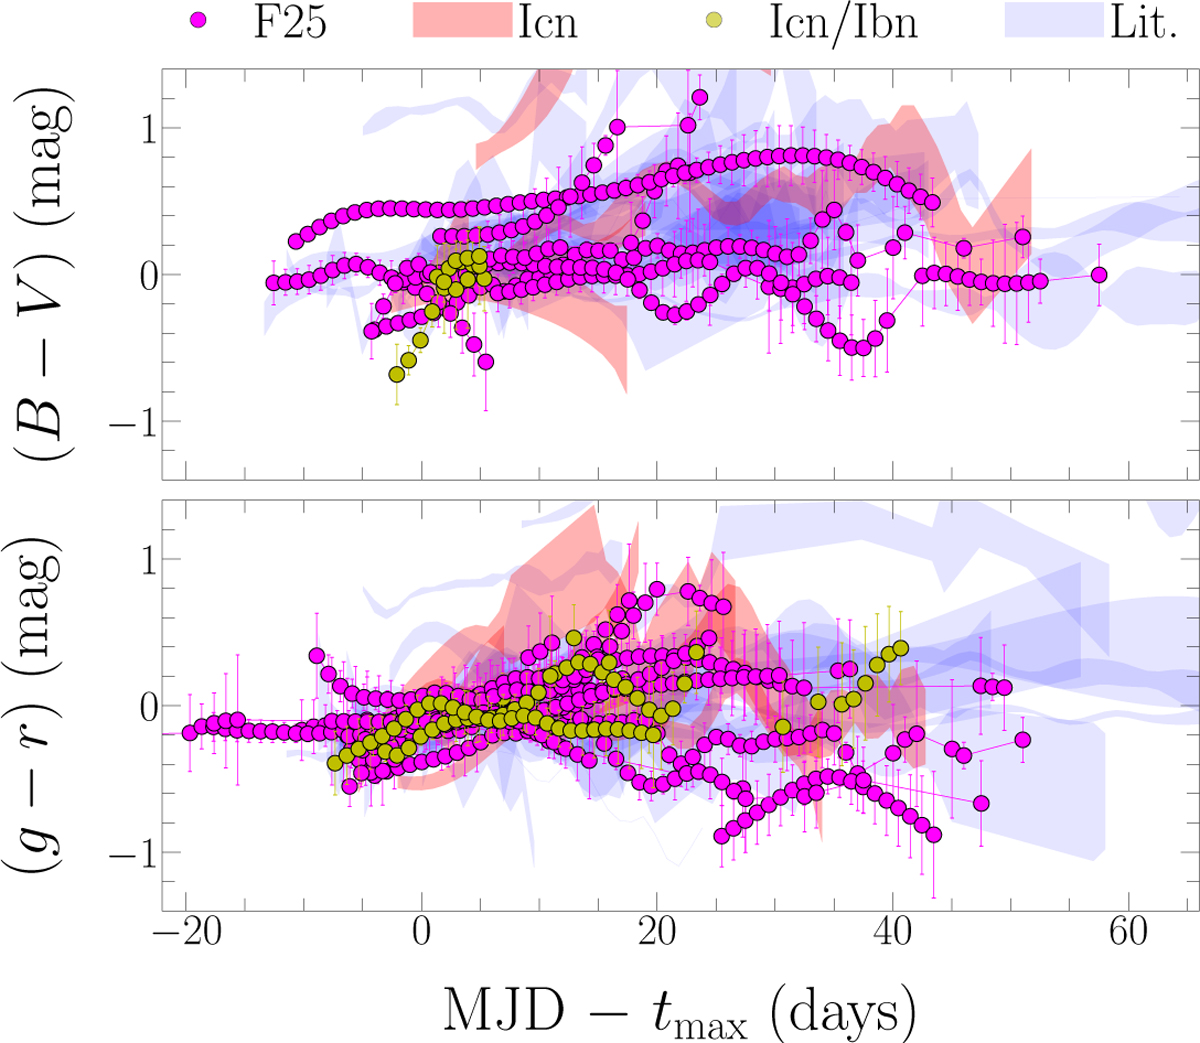
Interpolated B − V (top) and g − r (bottom) curves for the 24 SNe Ibn from F25 (magenta filled circles), the Icn/Ibn (2023emq-like: yellow filled circles) and the color curves (±1σ) of the Lit sample (blue regions). The color curves (±1σ) of five SNe Icn are included for comparison (red regions). The photometric data of the SNe Icn were retrieved from Gal-Yam et al. (2022); Perley et al. (2022); Fraser et al. (2021); Pellegrino et al. (2022a); Davis et al. (2023b).
Current usage metrics show cumulative count of Article Views (full-text article views including HTML views, PDF and ePub downloads, according to the available data) and Abstracts Views on Vision4Press platform.
Data correspond to usage on the plateform after 2015. The current usage metrics is available 48-96 hours after online publication and is updated daily on week days.
Initial download of the metrics may take a while.