Fig. 3
Download original image
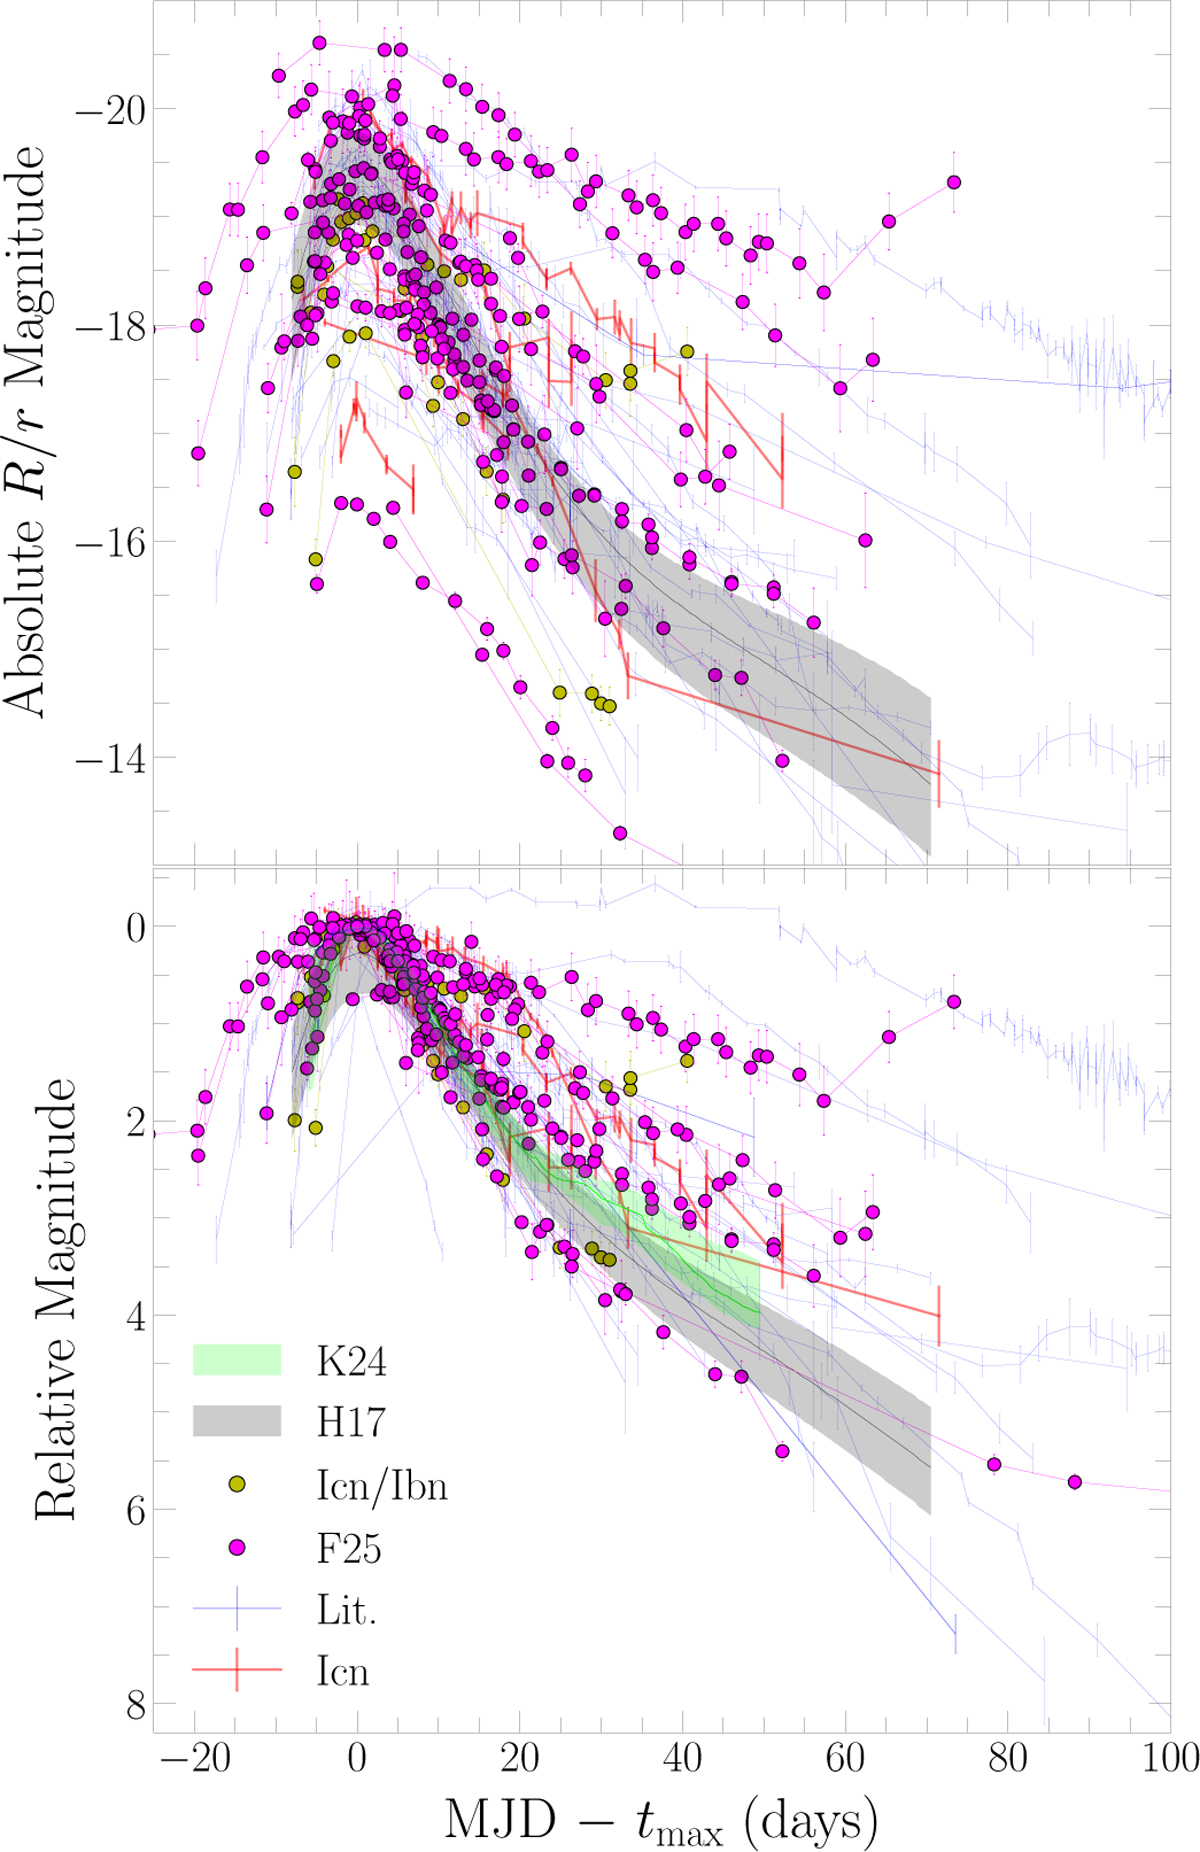
Top: absolute R/r-band-like light curves of all SNe Ibn from F25 sample that are first reported in this work (magenta dots) and Lit sample (blue lines). Gray (H17) regions correspond to the average light curve and 1.96σ error bars of 18 Type Ibn SNe from Hosseinzadeh et al. (2017). Yellow dots correspond to the likely Icn/Ibn SNe 2023emq (Pursiainen et al. 2023), 2023qre, 2023rau and 2023xgo (this work). Red lines correspond to the five Icn SNe discovered up to date. Bottom: same as the top panel, with the subtraction of the peak magnitude of each SN. Green (K24) regions correspond to the median light curve and the 25% and 75% percentiles from Khakpash et al. (2024).
Current usage metrics show cumulative count of Article Views (full-text article views including HTML views, PDF and ePub downloads, according to the available data) and Abstracts Views on Vision4Press platform.
Data correspond to usage on the plateform after 2015. The current usage metrics is available 48-96 hours after online publication and is updated daily on week days.
Initial download of the metrics may take a while.