Fig. 4
Download original image
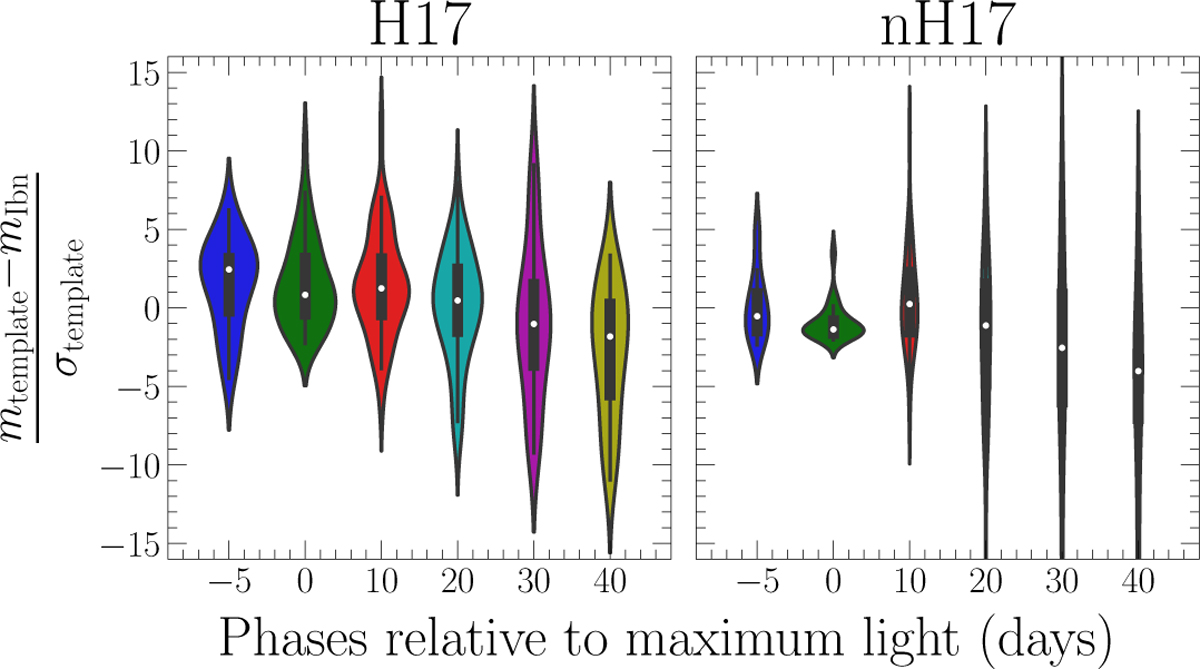
Left: kernel density estimate (KDE) of the difference between the magnitude of the H17 R/r-band template and the magnitude of the SNe Ibn in the total sample of this work (61) normalized by the uncertainty of the H17 template, in 10-day bins. The white dots correspond to the median of each KDE, while the black solid bars the interquartile range, i.e., the 25% and 75% percentiles. Right: same as left panel, for the normalized H17 (nH17) template.
Current usage metrics show cumulative count of Article Views (full-text article views including HTML views, PDF and ePub downloads, according to the available data) and Abstracts Views on Vision4Press platform.
Data correspond to usage on the plateform after 2015. The current usage metrics is available 48-96 hours after online publication and is updated daily on week days.
Initial download of the metrics may take a while.