Fig. 5
Download original image
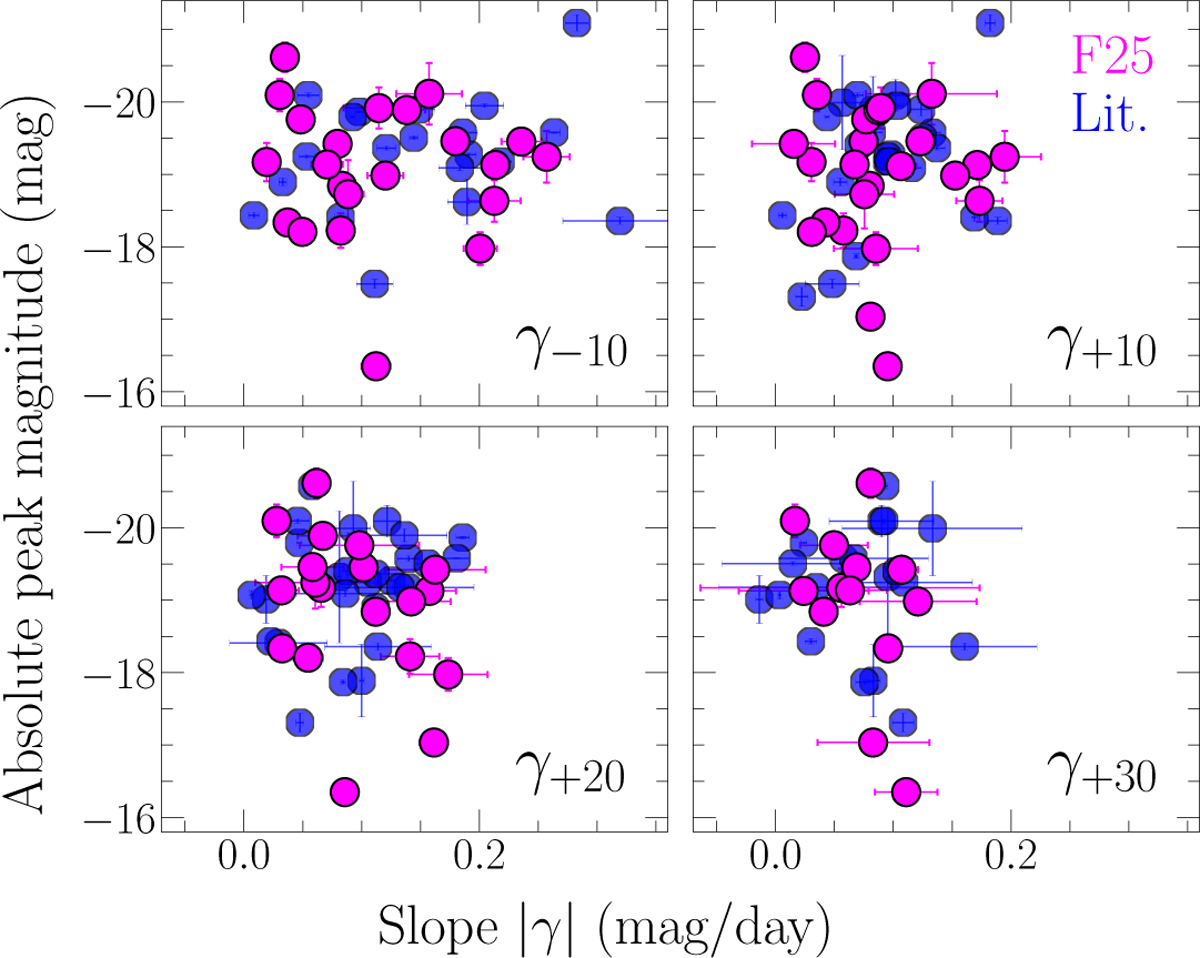
Absolute (R/r-band) peak magnitude versus the absolute value of the slope parameters of the (R/r-band) light curves (γ). The SNe Ibn from the F25 and Lit samples are presented as magenta and blue circles, respectively. The top-left, top-right, and bottom-right panels show the light curve slopes γ−10 (−10 to tmax), γ+10 (tmax to day +10), γ+20 (+10 to +20 days), and γ+30 (+20 to +30 days), respectively.
Current usage metrics show cumulative count of Article Views (full-text article views including HTML views, PDF and ePub downloads, according to the available data) and Abstracts Views on Vision4Press platform.
Data correspond to usage on the plateform after 2015. The current usage metrics is available 48-96 hours after online publication and is updated daily on week days.
Initial download of the metrics may take a while.