Fig. 6
Download original image
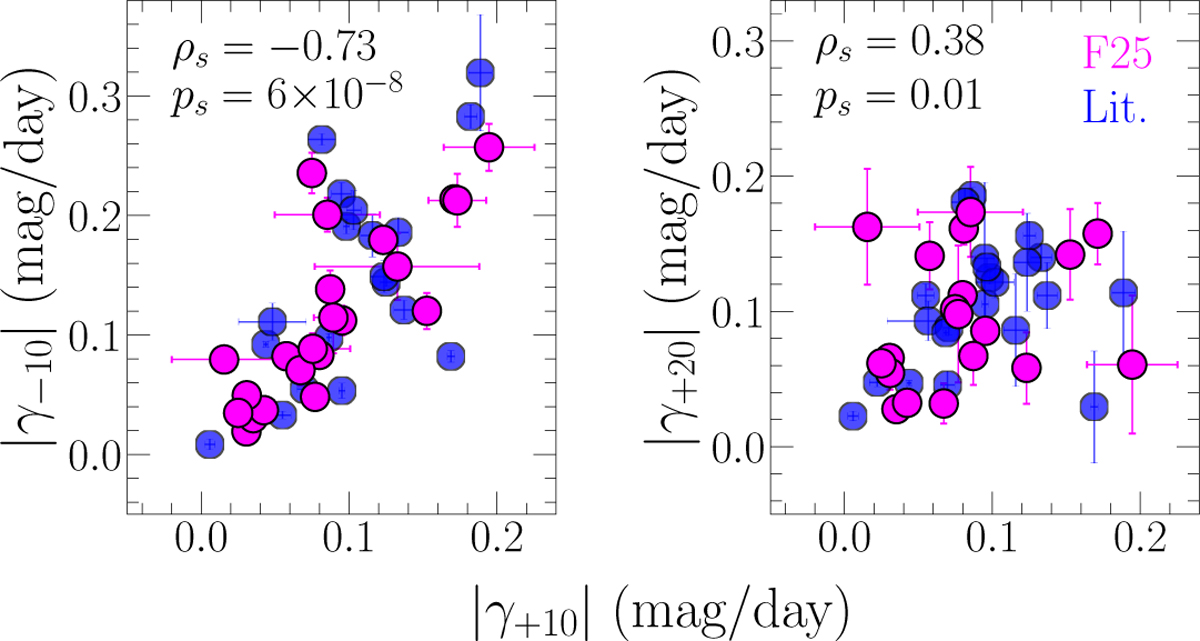
Absolute values of the R/r-band slopes γ−10 (left panel) and γ+20 (right panel) versus γ+10. The numbers within each plot are the Spearman’s coefficients and p-values for γ−10 versus γ+10 (left) and for γ+20 versus γ+10 (right). The SNe Ibn from the F25 and Lit samples are presented as magenta and blue circles, respectively.
Current usage metrics show cumulative count of Article Views (full-text article views including HTML views, PDF and ePub downloads, according to the available data) and Abstracts Views on Vision4Press platform.
Data correspond to usage on the plateform after 2015. The current usage metrics is available 48-96 hours after online publication and is updated daily on week days.
Initial download of the metrics may take a while.