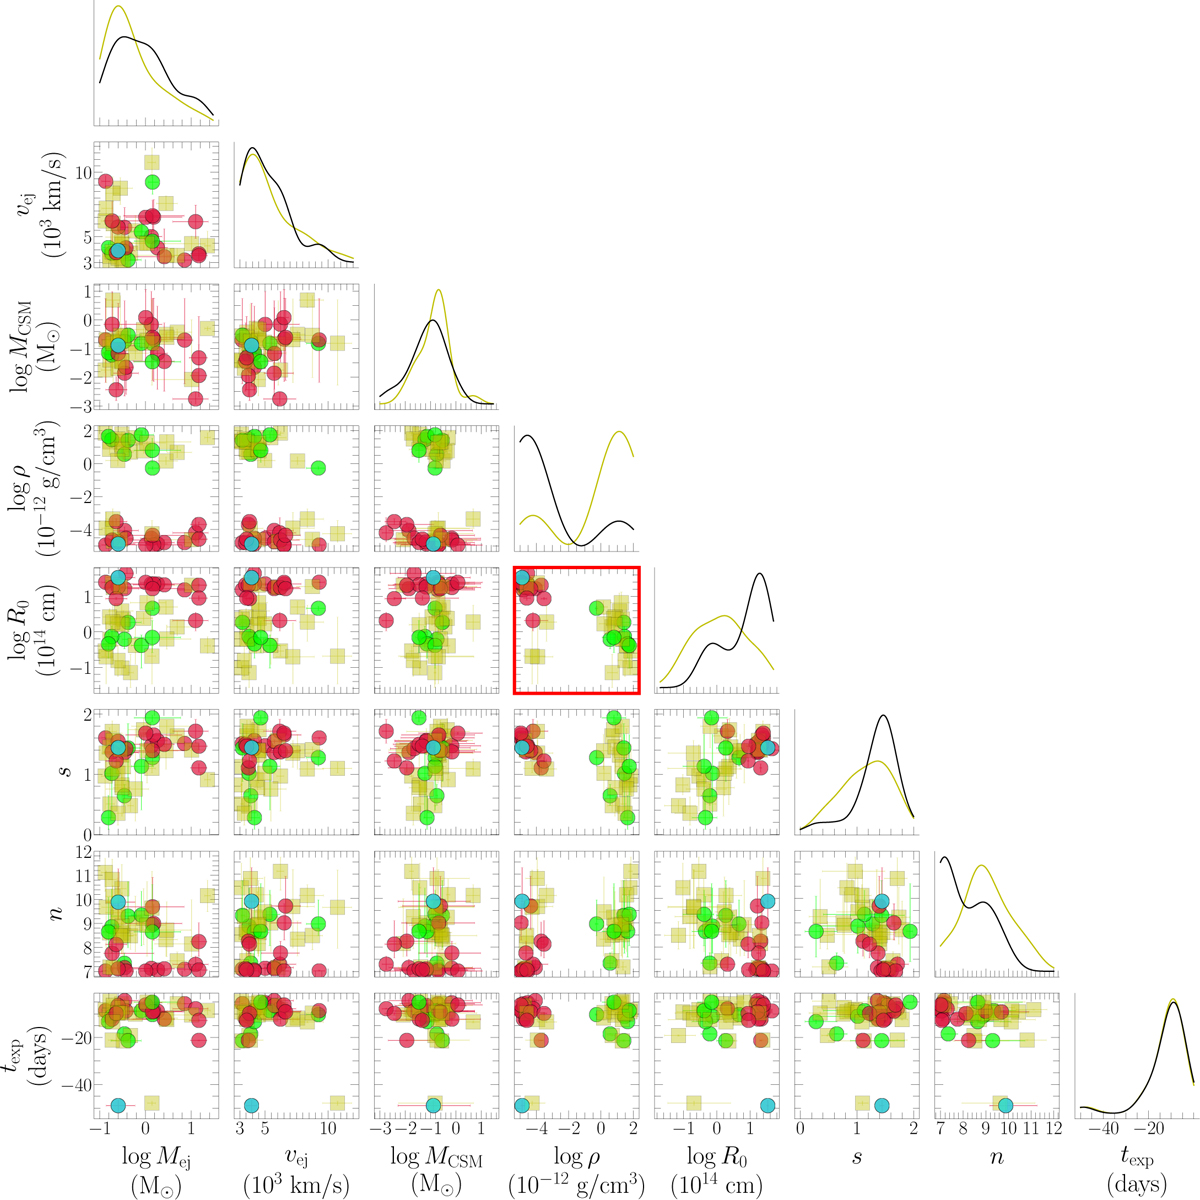
Fig. 7
Download original image
Inferred values of seven MOSFiT parameters for all 24 SNe in the MOSFiT sample. The parameters shown here are log Mej, vej, log MCSM, log ρCSM, with ρCSM in units of 10−12 g/cm3, log R0, with R0 in units of 1014 cm, s, n, and texp for the CSI (circle) and RD+CSI (square) models. The blue circle in each plot highlights the Type Ibn OGLE-2014-SN-131. For the CSI sample, the lime and crimson circles correspond to the SNe with ρCSM above or below 10−14 g/cm3, respectively. Probability density functions (PDFs) produced with a Gaussian kernel density estimator are shown along the diagonal. Black and yellow curves correspond to the PDF of a specific parameter for the CSI and RD+CSI models, respectively. The subplot with red axes highlights the correlation between ρCSM and R0, which is further explored in Fig. 8.
Current usage metrics show cumulative count of Article Views (full-text article views including HTML views, PDF and ePub downloads, according to the available data) and Abstracts Views on Vision4Press platform.
Data correspond to usage on the plateform after 2015. The current usage metrics is available 48-96 hours after online publication and is updated daily on week days.
Initial download of the metrics may take a while.