Open Access
Fig. 8
Download original image
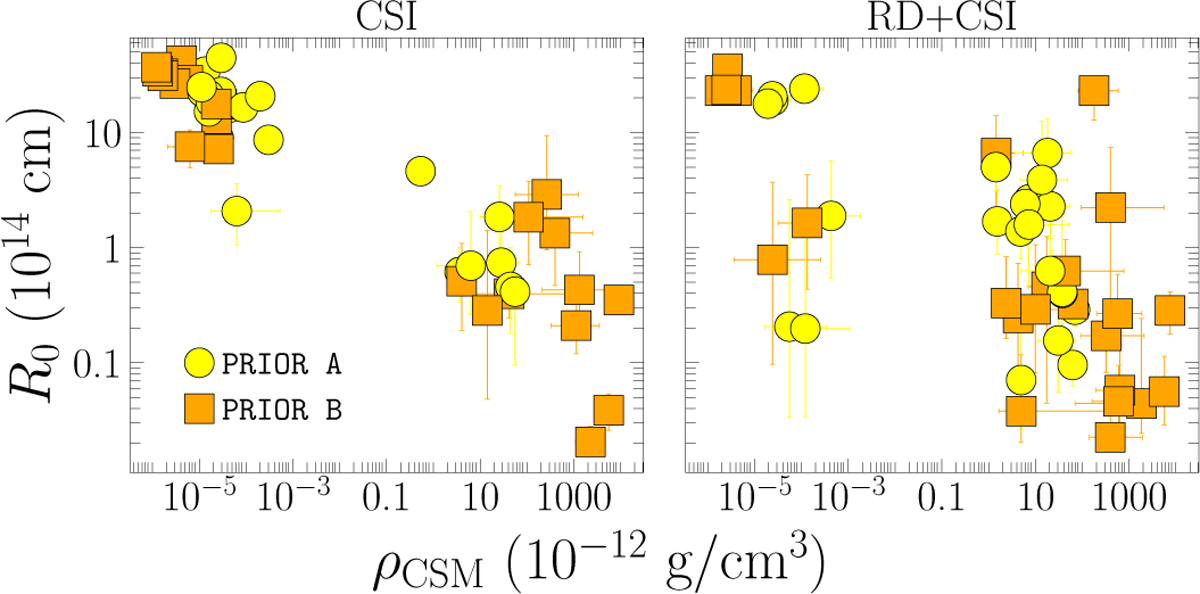
Left: median values of the posterior distributions of R0 versus ρCSM for each SN in the MOSFiT sample under the CSI model, using prior distributions A (yellow circles) and B (orange squares). Right: same as the left panel, but for the RD+CSI case.
Current usage metrics show cumulative count of Article Views (full-text article views including HTML views, PDF and ePub downloads, according to the available data) and Abstracts Views on Vision4Press platform.
Data correspond to usage on the plateform after 2015. The current usage metrics is available 48-96 hours after online publication and is updated daily on week days.
Initial download of the metrics may take a while.