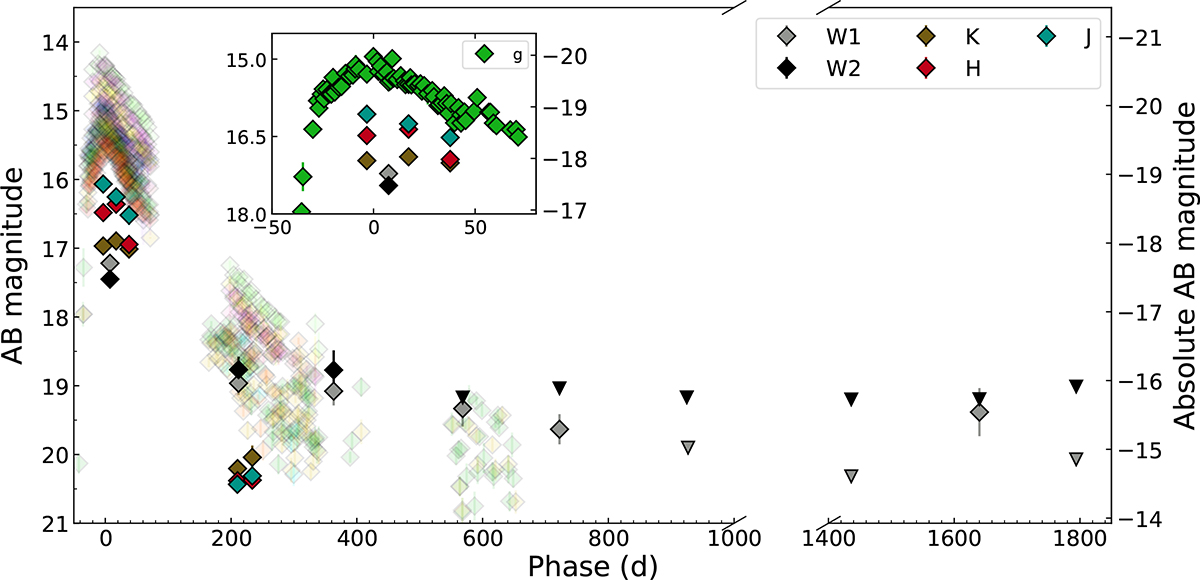
Fig. 1.
Download original image
Photometry of AT 2019azh. The IR photometry is shown with solid coloured symbols, while the extensive UVO photometry is shown using partially transparent symbols. Upper limits are indicated with downward facing triangles. The x-axis is broken as the omitted time period only contains upper limits. The inset plot shows the optical and IR light curves around peak in more detail.
Current usage metrics show cumulative count of Article Views (full-text article views including HTML views, PDF and ePub downloads, according to the available data) and Abstracts Views on Vision4Press platform.
Data correspond to usage on the plateform after 2015. The current usage metrics is available 48-96 hours after online publication and is updated daily on week days.
Initial download of the metrics may take a while.