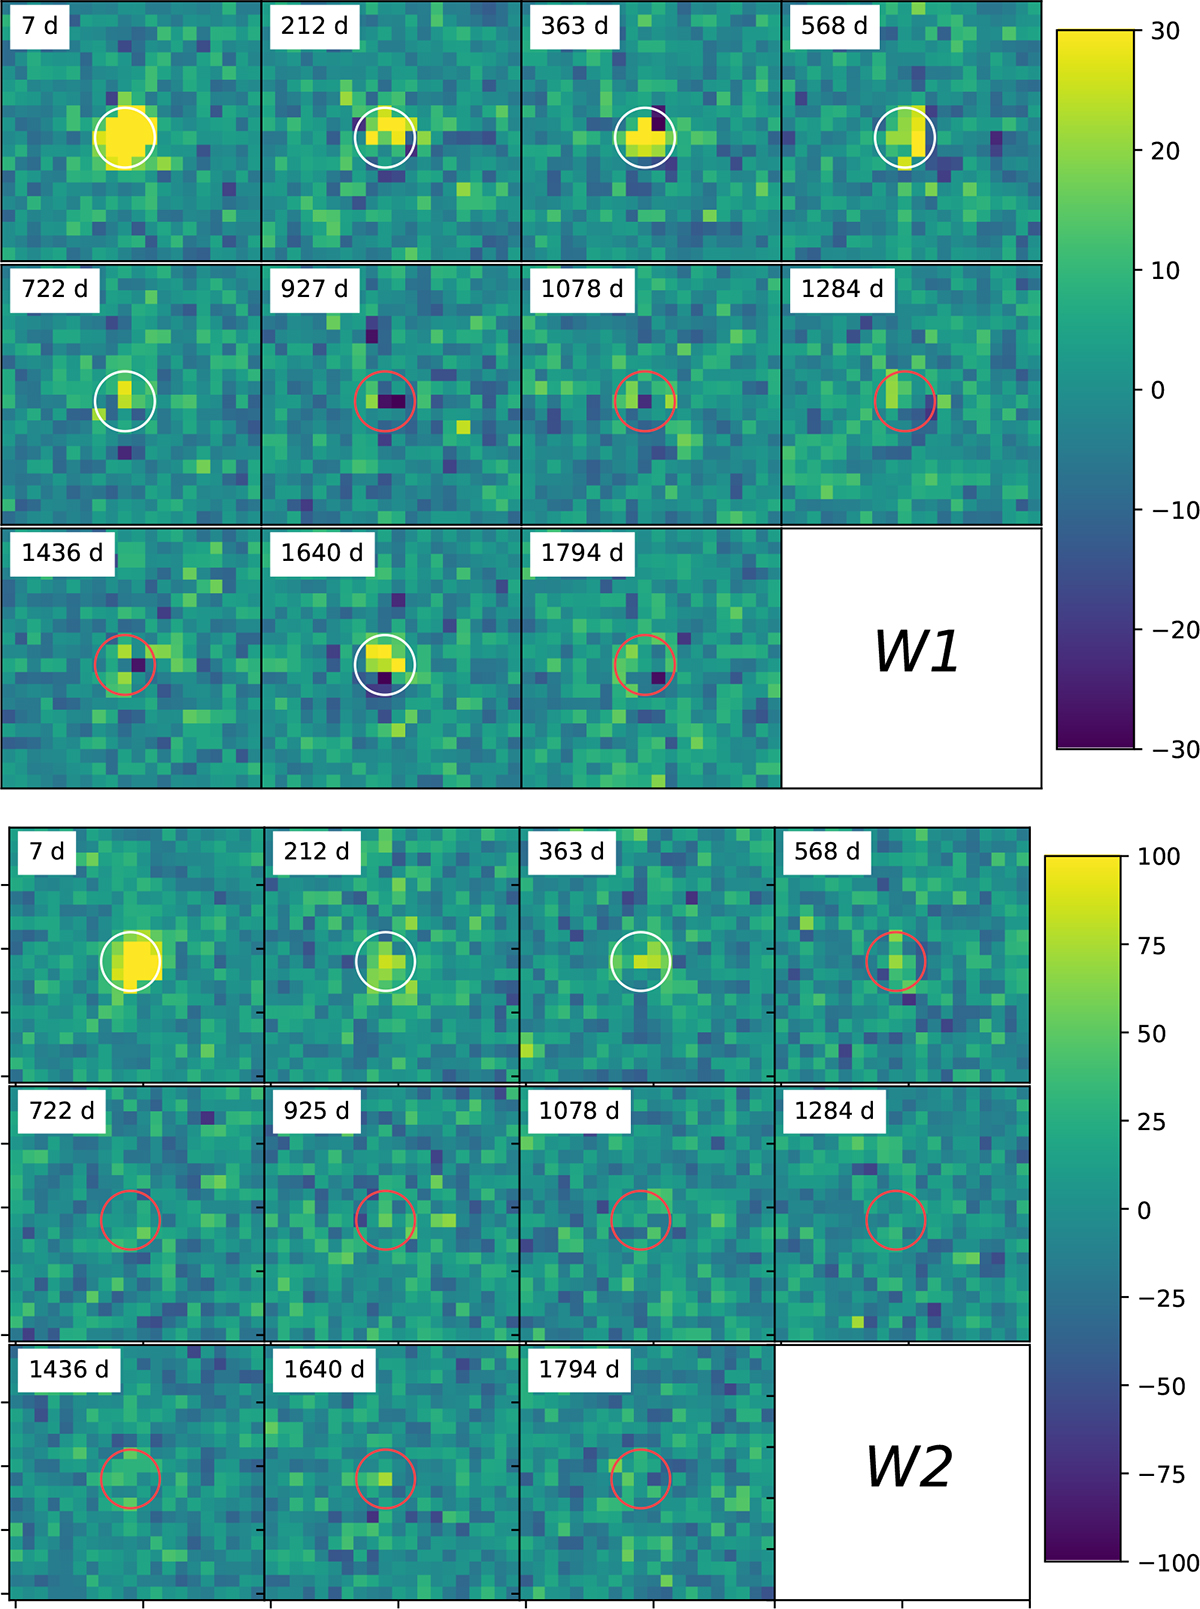
Fig. C.2.
Download original image
Subtraction residuals after template subtraction for the unWISE data, with the W1 and W2 band in the upper and lower panels respectively. A linear scaling that shows positive and negative values symmetrically around zero is used to clearly show dipole-like subtraction residuals. White and red circles indicate detections and non-detections, respectively. The radius of the circle corresponds to the FWHM of the image PSF.
Current usage metrics show cumulative count of Article Views (full-text article views including HTML views, PDF and ePub downloads, according to the available data) and Abstracts Views on Vision4Press platform.
Data correspond to usage on the plateform after 2015. The current usage metrics is available 48-96 hours after online publication and is updated daily on week days.
Initial download of the metrics may take a while.