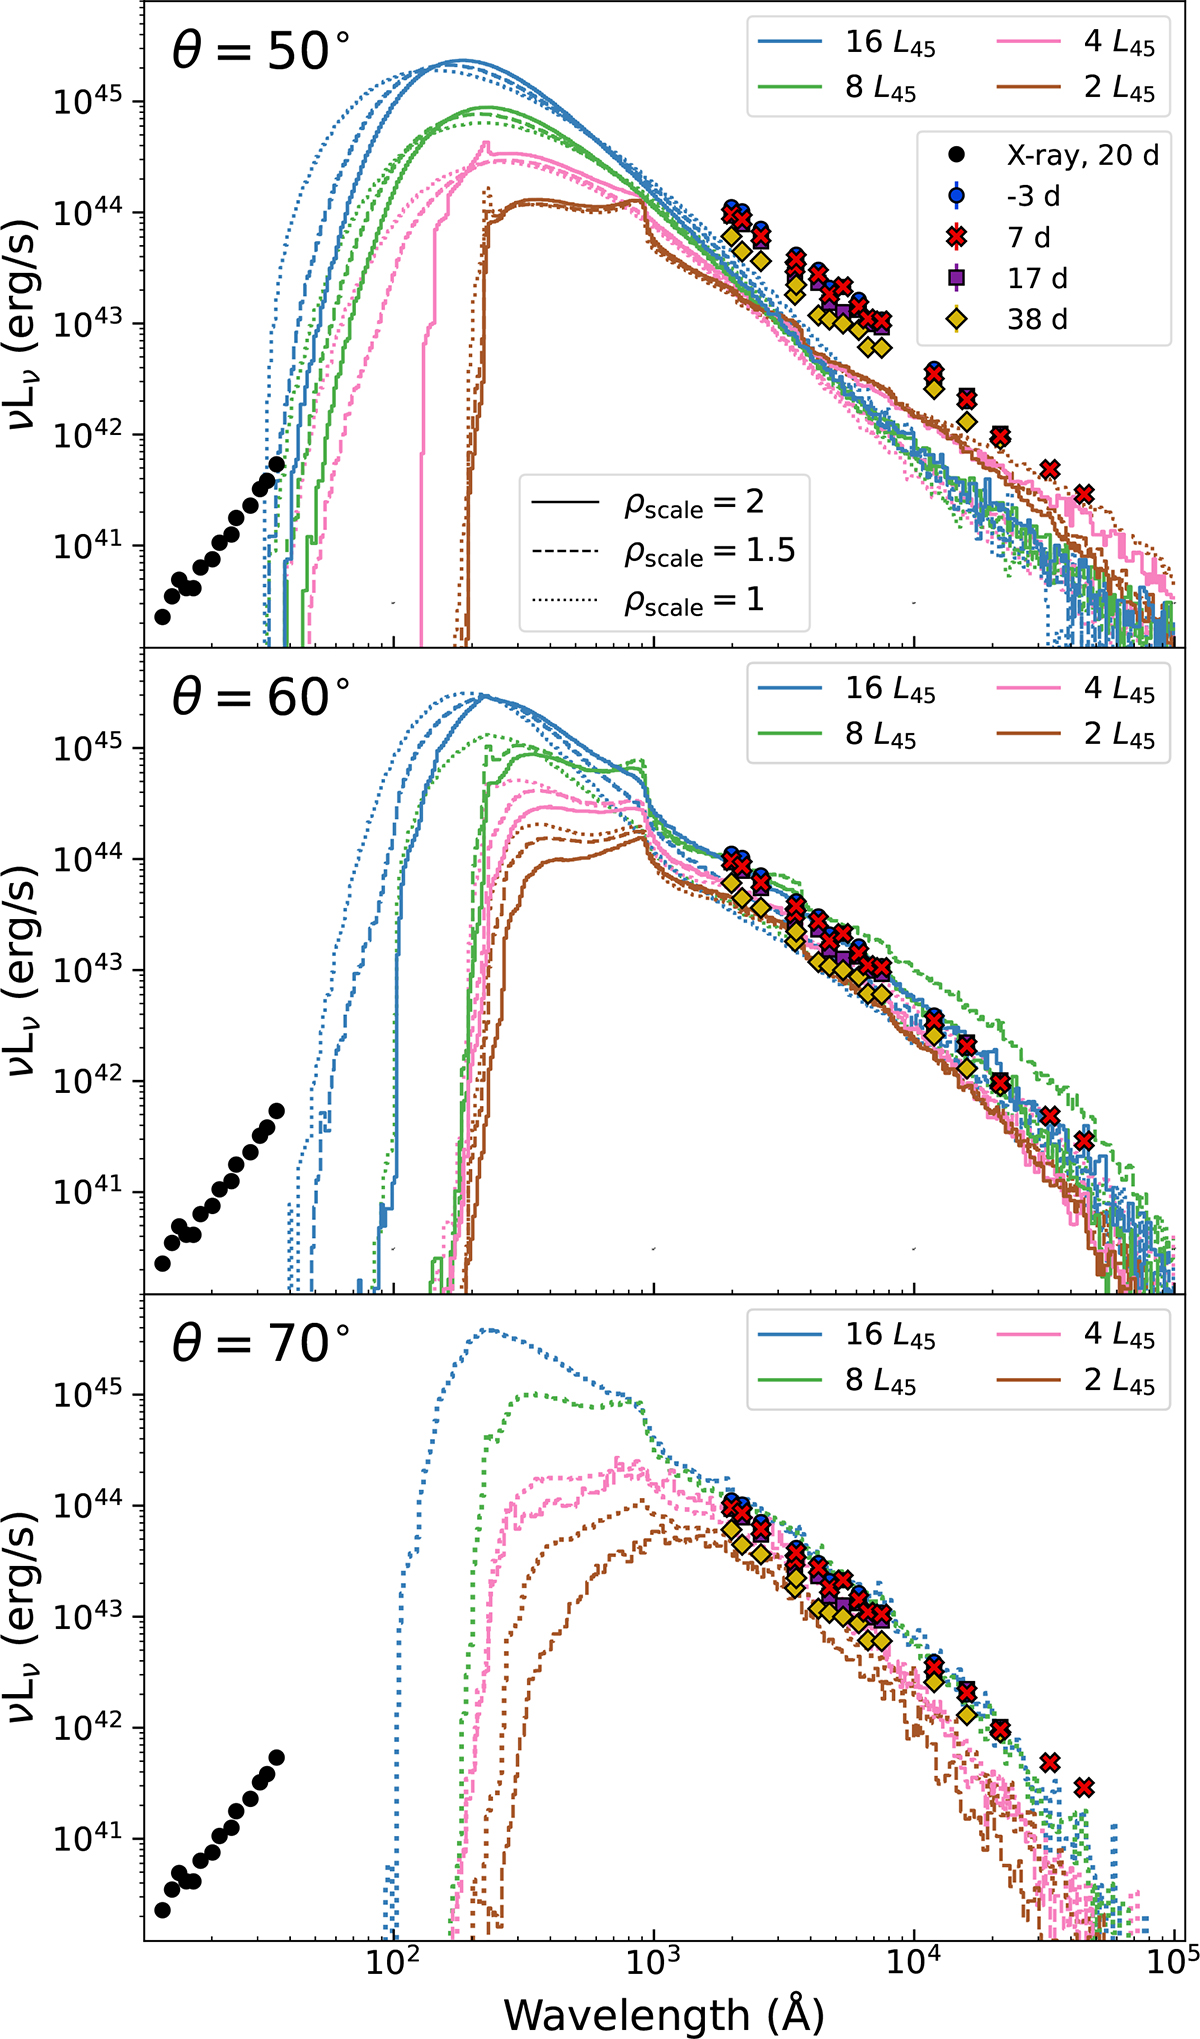
Fig. 4.
Download original image
Observed SEDs of AT 2019azh at epochs before 40 d, compared to the grid of simulated escaping spectra. The models have a wavelength grid such that the wavelength changes by 2% at each step, and are smoothed with a median filter of size 3. The top, middle, and bottom panels show models with 50°, 60°, and 70° inclinations, respectively. The colouring denotes the value of Linj as described in the legend, while the solid, dashed, and dotted lines represent models with a density profile scaling factor of 2, 1.5 and 1, respectively. We additionally show the X-ray spectrum observed at 20 d (Guolo et al. 2024) with black circles.
Current usage metrics show cumulative count of Article Views (full-text article views including HTML views, PDF and ePub downloads, according to the available data) and Abstracts Views on Vision4Press platform.
Data correspond to usage on the plateform after 2015. The current usage metrics is available 48-96 hours after online publication and is updated daily on week days.
Initial download of the metrics may take a while.