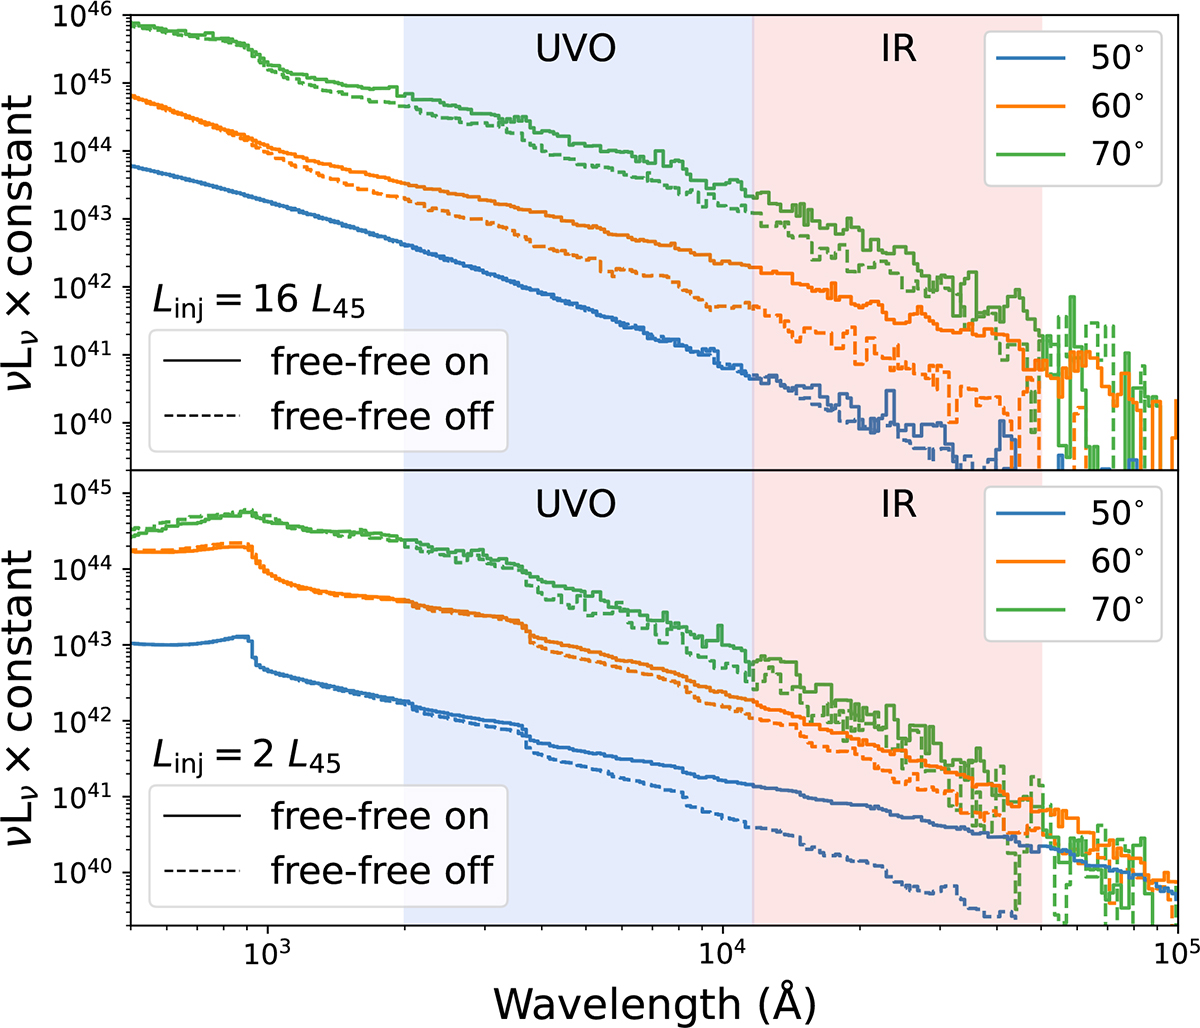
Fig. A.1.
Download original image
Simulated escaping spectra from our reprocessing model, with free-free opacity and emission on and off for the spectra drawn with a solid or dashed line respectively. All spectra have Ṁacc = 24 ṀEdd and ρscale = 1. The top and bottom panels have Linj = 16 × 1045 and 2 × 1045 erg s−1 respectively. The 50° and 70° spectra have been scaled by a factor of 0.1 and 5 respectively, to improve visual clarity. The spectral regions covered by UVO and IR observations are indicated by the blue and red shading respectively.
Current usage metrics show cumulative count of Article Views (full-text article views including HTML views, PDF and ePub downloads, according to the available data) and Abstracts Views on Vision4Press platform.
Data correspond to usage on the plateform after 2015. The current usage metrics is available 48-96 hours after online publication and is updated daily on week days.
Initial download of the metrics may take a while.