Fig. 1
Download original image
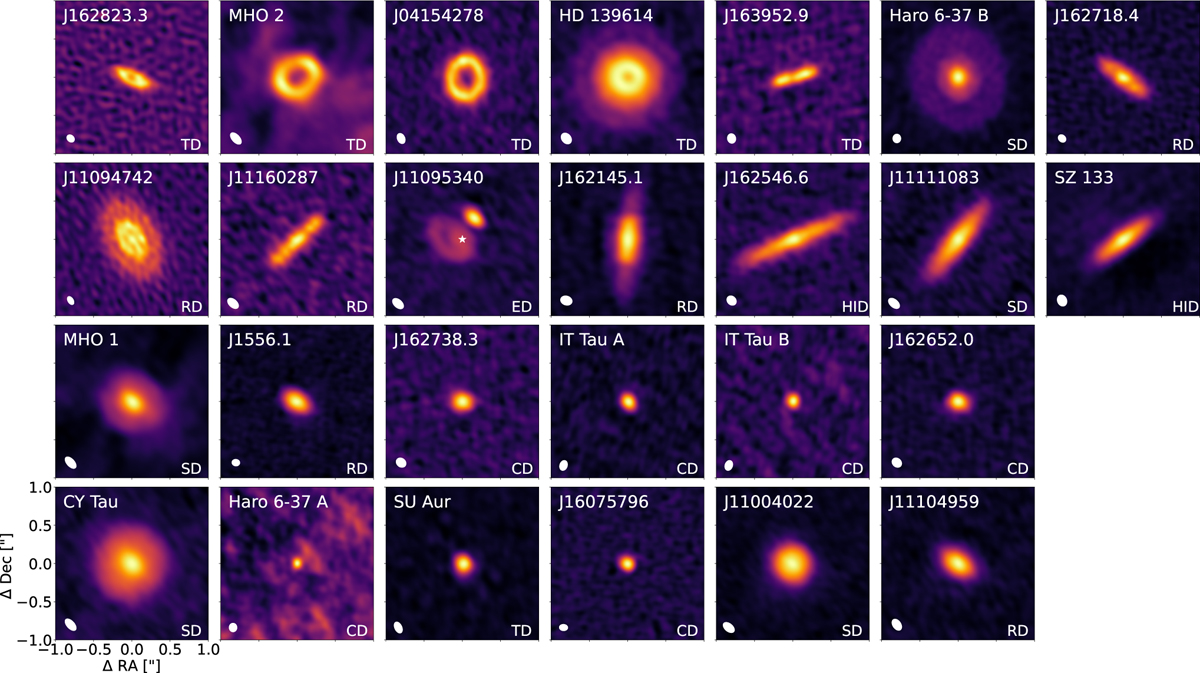
Gallery of the 1.3 mm cleaned continuum emission images for the full sample. All images were cleaned using a Briggs weighting scheme with a robust value of +0.5, except for SSTc2d J163952.9-241931 and SSTc2d J162718.4-243915 (robust = 0.0), and SSTc2d J162823.3-242241 and 2MASS J11094742-7726290 (robust = –0.5). RA and Dec offsets from the disc centre are shown in arcseconds on the x- and y-axes, respectively. To emphasise the weak outer emission of a few discs, an asinh scaling function was applied. Each panel spans 2.0′′ × 2.0′′, with white ellipses in the lower left corner indicating the beam sizes. The colour scale represents the intensity in Jansky per beam. The final disc classifications are marked in the lower right corner: TD, RD, SD, HID, CD, and ED. For discs with names starting with SSTc2d, 2MASS, or RX, the names in the upper left corners are abbreviated to the first part after J (e.g. SSTc2d J162823.3-242241 is labelled as J162823.3). The white star in 2MASS J11095340-7634255 marks the current position of the central star.
Current usage metrics show cumulative count of Article Views (full-text article views including HTML views, PDF and ePub downloads, according to the available data) and Abstracts Views on Vision4Press platform.
Data correspond to usage on the plateform after 2015. The current usage metrics is available 48-96 hours after online publication and is updated daily on week days.
Initial download of the metrics may take a while.