| Issue |
A&A
Volume 708, April 2026
|
|
|---|---|---|
| Article Number | A143 | |
| Number of page(s) | 21 | |
| Section | Planets, planetary systems, and small bodies | |
| DOI | https://doi.org/10.1051/0004-6361/202556059 | |
| Published online | 03 April 2026 | |
Gaps and rings: a near-universal trait of extended protoplanetary discs
1
Leiden Observatory, Leiden University,
PO Box 9513,
2300 RA
Leiden,
The Netherlands
2
Instituto de Astrofísica, Pontificia Universidad Católica de Chile,
Av. Vicuña Mackenna 4860,
7820436
Macul, Santiago,
Chile
★ Corresponding author: This email address is being protected from spambots. You need JavaScript enabled to view it.
Received:
23
June
2025
Accepted:
13
February
2026
Abstract
Context. Substructures such as rings, gaps, and cavities are commonly observed in protoplanetary discs and are thought to play a key role in dust evolution and planet formation. However, a fraction of the extended discs (68% dust radii >30 AU) in nearby star-forming regions remain unresolved, leaving their substructure content uncertain and thereby limiting our understanding of dust evolution and the initial conditions for planet formation across the full disc population.
Aims. We aim to investigate the presence of substructures in previously unresolved, extended discs to assess whether all extended protoplanetary discs in the solar neighbourhood exhibit substructures. This enables a statistical evaluation of substructure occurrence among protoplanetary discs and provides statistical constraints for disc evolution models and comparisons with exoplanet populations.
Methods. We present new high-resolution (∼0.12′′) ALMA (Atacama Large Millimeter/submillimeter Array) Band 6 continuum observations at 1.33 mm of 26 previously unresolved, extended discs within 200 pc. This completes the sample of high-resolution observations of extended discs in the nearby star-forming regions Taurus, Ophiuchus, Chamaeleon, Lupus, Upper Scorpius, Upper Centaurus-Lupus, and Lower Centaurus-Crux. We analysed radial intensity profiles using Frankenstein and Galario to detect substructures.
Results. Seventeen discs show clear substructures, while nine appear compact and structureless, smooth, or ambiguous due to inclination or possible binarity or late-stage infall. We detect 12CO J=2-1 emission in 15 discs, where extended CO emission is observed in four discs. Combined with literature data, our complete sample of 730 protoplanetary discs reveals that nearly all extended discs exhibit substructures, ∼91% detected in the full sample, and up to ∼98% when correcting for high-inclination systems where substructures may be hidden.
Conclusions. Substructures are a near-universal feature of extended protoplanetary discs. Substructures are more commonly detected and, it is proposed, more prevalent in larger, massive discs and around higher-mass stars, and structured discs retain their dust mass over time. This is consistent with the hypothesis that dust traps, possibly induced by giant planets, are key in shaping the dust disc morphologies.
Key words: planets and satellites: formation / protoplanetary disks / planet-disk interactions
© The Authors 2026
 Open Access article, published by EDP Sciences, under the terms of the Creative Commons Attribution License (https://creativecommons.org/licenses/by/4.0), which permits unrestricted use, distribution, and reproduction in any medium, provided the original work is properly cited.
This article is published in open access under the Subscribe to Open model. This email address is being protected from spambots. You need JavaScript enabled to view it. to support open access publication.
1 Introduction
Substructures in the dust distribution of protoplanetary discs, such as rings, gaps, cavities, and spirals, are frequently observed in large, bright discs, particularly those resolved with high-resolution ALMA (Atacama Large Millimeter/submillimeter Array) observations (e.g. Andrews et al. 2018; Huang et al. 2018; Long et al. 2018). However, this trend is shaped by observational biases: most high-resolution studies have focused on the brightest and most extended discs. In comparison, compact discs (CDs; here defined as dust discs with 68% dust radii <30 AU) appear to show fewer substructures, as confirmed by the complete high-resolution survey of the Lupus star-forming region (Guerra-Alvarado et al. 2025). These dust features are key to understanding the evolution of protoplanetary discs and the early stages of planet formation. However, Bae et al. (2023) demonstrated that substructures are more likely to be detected for discs resolved well beyond the angular resolution, which makes an analysis of dust processes across disc sizes challenging.
Dust grains in protoplanetary discs undergo complex evolution; they grow through coagulation, experience fragmentation, and drift radially due to aerodynamic coupling with the gas. Radial drift, in particular, leads to the rapid inward migration of millimetre-sized grains, posing a challenge to planet formation models that require retention of solid material at large radii (Weidenschilling 1977; Birnstiel 2024). Pressure bumps in the gas can act as dust traps, halting radial drift and enabling the accumulation of solids. These traps often result in ring-like substructures in the dust continuum, and are considered critical sites for planetesimal formation (Pinilla et al. 2012; Dullemond et al. 2018).
Several demographic studies of protoplanetary discs have explored the connection between disc properties and stellar mass, age, and the star-forming region (e.g. Ansdell et al. 2016; Barenfeld et al. 2016; Cieza et al. 2019). These surveys revealed trends such as larger and more massive discs around higher-mass stars, but lacked the angular resolution to probe the substructures. It has also been suggested that the occurrence of discs with large-scale substructures may correlate with stellar mass (van der Marel & Mulders 2021) with a similar trend for transition discs (TDs; van der Marel 2023), supported by similar trends in exoplanet demographics where giant planets are more frequently found around higher-mass stars (Johnson et al. 2010). This similarity hints at a causal connection, whereby giant planets may be responsible for shaping the disc by carving rings and gaps during their formation. A growing body of evidence points to planet-disc interactions as a dominant cause, particularly for large-scale ringed structures (see e.g. Baruteau et al. 2014; Zhang et al. 2018), although other processes such as magnetically induced zonal flows (Hawley 2001), dead zones (Flock et al. 2015), and condensation fronts (Zhang et al. 2015) have also been proposed.
However, several protoplanetary discs in nearby star-forming regions remain unresolved or only marginally resolved, since generally only the brightest discs have been followed up with high-resolution observations. The study by van der Marel & Mulders (2021) phrased the hypothesis that discs could be divided up into structured, extended discs (EDs) and smooth CDs, based on their findings that the structured discs retain similar millimetre flux densities when comparing discs in younger and older regions, whereas the millimetre flux densities of smooth CDs, the majority of the disc population, decrease over time. This would be consistent with a scenario in which structured discs contain strong dust traps, whereas smooth discs do not, and radial drift reduces their observable millimetre emission over time, following dust evolution models (Pinilla et al. 2020). Gas-to-dust size ratios have been predicted to be measurements of discs with and without dust traps (Toci et al. 2021), but interpreting 12CO emission sizes as a direct tracer of the physical extent of the gas disc has been proven to be very challenging (Trapman et al. 2019). Recently, Pinilla et al. (2025) classified the discs in Lupus and Upper Scorpius as either structured or smooth based on visibility modelling. They concluded that since the smooth discs only change in millimetre flux but not in size as a function of evolution, the smooth discs are consistent with weak or leaky dust traps, in contrast to the strong dust traps seen in structured discs. The division in two pathways of dust evolution is also seen in, for example, Herbig discs (Stapper et al. 2022) and reflected in the observations of sublimated H2O in infrared spectra, for which radial drift has been proposed as a possible interpretation (e.g. Banzatti et al. 2020, 2023). Recent JWST obserrvations reveal a substantial intrinsic scatter in H2O emission properties (Gasman et al. 2025). While a comprehensive explanation is still under investigation, part of this diversity may reflect evolutionary effects as explored in recent modelling efforts (Krijt et al. 2025). Whereas caution is warranted in the interpretation of low-resolution ALMA observations (Bae et al. 2023), we build further on the hypothesis of separate evolutionary pathways in this new study with follow-up observations of the EDs.
In the work by van der Marel & Mulders (2021), a population of large discs with radii >40 AU was classified as EDs that appeared smooth due to a limited angular resolution. Such discs are unlikely to remain extended without the presence of substructures that prevent radial drift, according to dust evolution models. Yet the hypothesis that these unresolved discs contain undetected rings and gaps remained untested due to the lack of high-resolution data for these EDs.
This study aims to address this question by analysing a new sample of 26 extended protoplanetary discs in the nearby star-forming regions Taurus, Ophiuchus, Chamaeleon, Upper Centaurus-Lupus, Upper Scorpius, and Lupus, with 68% dust disc radii larger than 30 AU, observed with high-resolution ALMA imaging for the first time. The choice of a 30 AU threshold for EDs is motivated by the unbiased ALMA survey of the Taurus star-forming region at 0.12′′ resolution by Long et al. (2018, 2019), which showed that discs with dust radii ≳30 AU are robustly resolved and representative of the spatially ED population in nearby regions. We modelled the radial emission structure of each disc using the tools Frankenstein and Galario, identifying and characterising rings and gaps where present. By completing the high-resolution sample of EDs within 200 pc, this work enables a statistical assessment of substructure occurrence, providing key inputs for models of planet formation and comparison with exoplanet population trends.
We discuss the sample selection and observations in Sect. 2 and the analysis of the dust continuum observations in Sect. 3. In Sect. 4 we present the modelling approach for the disc substructures and the corresponding results. In Sect. 5 we discuss the dust substructures of our sample and analyse the complete sample of nearby extended protoplanetary discs, thereby answering the question whether all EDs contain substructures. Finally, the conclusions of this work are summarised in Sect. 6.
2 Sample and observations
2.1 Sample selection
The sample of analysed protoplanetary discs in this work was selected from the van der Marel & Mulders (2021) catalogue. This catalogue contains nearly 700 discs from nearby star-forming regions within a 350 pc radius, classified by observed dust morphology: 42 TDs with inner cavities >25 AU, 37 ring discs (RDs), 474 smooth discs, and 147 non-detections. The smooth discs were further classified into extended (>40 AU disc radius (68%)) and compact (<40 AU disc radius (68%)) discs. Since the publication of van der Marel & Mulders (2021), some EDs have been observed at high angular resolution, revealing rings, gaps, and cavities (see e.g. Villenave et al. 2020, 2022; Cieza et al. 2021). We selected all discs with 68% dust disc sizes larger than 30 AU that have not yet been observed at high angular resolutions, excluding distant discs, resulting in a sample of 23 star systems observed in the ALMA programme presented in this study. This includes three binary discs, yielding a total of 26 protoplanetary discs, located in the Taurus, Ophiuchus, Chamaeleon, Upper Centaurus-Lupus, Upper Scorpius, and Lupus star-forming regions.
The 30 AU threshold for EDs was motivated by the unbiased ALMA disc survey of the Taurus star-forming region at 0.12′′ by Long et al. (2018, 2019). While this study focuses on high-resolution observations of these 26 discs, the discussion section expands to the broader population of EDs identified in van der Marel & Mulders (2021) and explores their statistical properties in relation to stellar mass and other parameters. The full sample is detailed in Table 1. Table A.1 lists the host star properties, estimated dust disc sizes (column 6), and dust masses (column 7), taken from literature. For some discs, the dust sizes represent upper limits (indicated by ‘<’).
A discrepancy in the sample selection should be noted. SSTc2d J162738.3-235732, with a dust disc radius already known to be smaller than 14 AU, was mistakenly included as an ED in the ALMA proposal due to a catalogue error in van der Marel & Mulders (2021). SSTc2d J162738.3-243648 should have been included in the ALMA programme instead. However, since SSTc2d J162738.3-235732 has now been observed at high angular resolution it will still be analysed in addition to the ED sample in order to accurately determine its true dust radius and assess potential substructures within this CD. Additionally, Haro 6-37 A and MHO 1, with radii below 30 AU, are part of binary systems where their companions (Haro 6-37 B and MHO 2) exceed the 30 AU threshold. For the third binary system, both IT Tau A and IT Tau B have dust radii near the inclusion limit (32 AU).
Continuum flux densities and properties of the sample of discs.
2.2 Observations
The 23 systems were observed during the ALMA Cycle 9 programme (PI: G. Mulders; programme ID: 2022.1.01302.S) between January 2, 2023 and June 2, 2023 in Band 6 (1.33 mm) with high spatial resolutions (∼0.12′′). Additional observations at a lower resolution (∼0.6′′) were requested for short baseline coverage, but only nine discs were observed in the short baseline configuration. For each observation, the ALMA correlators were configured into four separate basebands. Two windows were allocated for continuum observations, with central frequencies at 218 and 233 GHz, each having a bandwidth of 1.875 GHz. The other two windows were designated for molecular line emission observations, centred at 220 and 230 GHz, targeting the 12CO, 13CO, and C18O J=2-1 lines, with bandwidths of 0.234 GHz each, and a channel resolution of 0.184 km/s. For the lower angular resolution observations, On-source integration times ranged between ∼3 and ∼5 minutes per target and for the higher angular resolution observations, the integration times ranged between ~10 and ∼30 minutes per target. The high-resolution observations of 2MASS J04154278+2909597 and 2MASS J16075796-2040087, along with the low-resolution observation of SSTc2d J163952.9-241931, were conducted over several days. Table A.2 summarises the observational details.
A standard ALMA pipeline calibration was performed by the ALMA staff for both the high- and low-angular-resolution datasets. The low-resolution observations were calibrated using CASA version 6.4.1.12 with pipeline version 2022.2.0.64, while the high-resolution observations were calibrated using pipeline version 2022.2.0.68. The standard calibration included offline water vapour radiometer calibration, system temperature correction, bandpass, phase, amplitude, and flux calibrations. The images included in the data delivery were corrected for the primary beam response. Self-calibration was performed using the CASA tclean and gaincal tasks, starting with phase-only solutions on progressively shorter solution intervals, followed by a final round including amplitude self-calibration where the signal-to-noise ratio permitted. Typical improvements in peak signal-to-noise ranged from 20–40%.
2.2.1 Post-processing of the dust continuum data
The final 1.3 mm dust continuum datasets were produced by averaging the calibrated visibilities over the continuum channels. Images were created using CASA’s tclean with Briggs weighting and a robust parameter of +0.5, adjusted to 0.0 or −0.5 for sources with immediately resolved substructures. We have checked the effects of frequency smearing for our binary sources and find differences of less than 6% in the flux densities when averaging over all channels compared to using a single spectral window. We consider this negligible for the purposes of this work.
Several discs were initially off-centred due to outdated RA and Dec co-ordinates used for telescope pointing. To correct this, the CASA phaseshift task was applied to align the discs. For the nine discs with both high- and low-resolution data, datasets were combined using CASA’s concat task and re-imaged with tclean. The average beam size of the final images is ∼0.15 × 0.11′′.
2.2.2 Post-processing of the CO line emission data
The 12CO line channel maps were extracted from the calibrated visibilities by subtracting the continuum emission from the phase-shifted UV data using CASA’s uvcontsub task with a polynomial of order 0. The line emission was cleaned using Briggs weighting with a robust parameter of +0.5. The 12CO J=2-1 transition line, with a rest frequency of 230.538 GHz, was detected in 15 discs (see column 6 in Table 1). For non-detections, cleaning with natural weighting was attempted as well, but this did not result in additional detections. For discs with both high- and low-resolution data available, low-resolution data was preferred for its sensitivity to large-scale structures, providing higher signal-to-noise ratios due to better UV coverage at shorter baselines (see column 5 in Table A.2).
Moment 0 maps were created by integrating over all velocity channels with detected emission, and moment 1 maps by calculating the intensity-weighted mean velocity over the same channels. Velocity ranges for each disc were determined from visual inspection of the channel maps. The moment maps were generated using the bettermoments package (Teague & Foreman-Mackey 2018). The 12CO gas observations are shown and analysed in Appendix B.
3 Dust continuum results
3.1 Flux densities
The flux densities, root mean square (RMS) of the background noise, and refined source centre co-ordinates of the 26 proto-planetary discs are summarised in Table 1. For comparison, previously published Band 6 flux densities are also included. We calculated two types of flux densities for each disc. First the flux density integrated above a 3σ threshold (F3σ), with σ the RMS of the background noise. Second, the total flux density derived from the curve-of-growth (CoG) method (FCoG), corresponding to the asymptotic value where the CoG curve flattens (see Sect. 4.2). Both approaches give similar values in the total flux density. For consistency, these values were calculated from the high-angular-resolution images, cleaned using a Briggs weighting scheme with a robustness parameter of +0.5. The derived flux densities range between 1.3 and 203.0 mJy. The RMS noise for most discs falls within the range between 0.03 and 0.07 mJy/beam, with the exception of the two discs in the MHO 1+2 system, which exhibit an elevated RMS of 0.24 mJy/beam.
Our calculated flux densities generally align with previous measurements, within the expected 10% ALMA Band 6 calibration uncertainty, except for Haro 6-37 B. This discrepancy may stem from the lower RMS and image fidelity in Akeson et al. (2019), as their ALMA Cycle 2 observations were taken during ALMA Early Science with an incomplete array. Differences in central frequency also likely contribute to the flux variation.
Small discrepancies between measurements can stem from differences in calibration, data reduction, and cleaning techniques. We used a uniform approach in calculating the flux densities across our dataset. Given the general agreement with prior studies within 10% flux calibration uncertainty and our consistent methodology, we can conclude that the presented flux densities are robust.
3.2 Disc features
Figure 1 presents the 1.3 mm cleaned continuum images of the 26 sources. For the nine discs with both long and short baseline configuration data (see Table A.2) concatenated images are shown. For the remaining discs, only the high-resolution images are displayed. Visual inspection of the cleaned images immediately reveals that some discs exhibit flux deficits, indicating the presence of gaps and cavities within these discs. Based on these images, we can visually classify the discs into four distinct categories: TDs, RDs, highly inclined discs (HIDs), and discs lacking visual substructures, as described below.
Transition discs are characterised by a depleted central cavity, indicative of significant flux deficit at the centre of the disc. Ring discs, in contrast, exhibit alternating patterns of dust enhancements and depletions that create distinct annular ring structures, without a central cavity. Highly inclined discs (>75◦ inclination), the orientations of which conceal internal features, are classified as inclined discs, emphasising the impact of viewing geometry on their appearance. Discs appearing more face-on that lack discernible substructures and appear featureless in the continuum images are classified as discs lacking visual substructures.
Based on these visual classifications, we identified five TDs, four RDs, four HIDs, and twelve discs lacking visual substructure. One disc, 2MASS J11095340-7634255, could not be categorised due to its complex morphology, featuring a complex object adjacent to an extended, spiral-like structure. Based on the current position of the central star, indicated by a white star in the cleaned image, it is likely that the more extended object represents the protoplanetary disc surrounding the central star. However, the continuum image alone does not provide sufficient information to identify the nature of the adjacent compact object.
4 Modelling disc substructures
4.1 Modelling approach
The dust continuum data were analysed in the visibility plane to assess the presence of substructures in all protoplanetary discs in our sample. Each disc was modelled as a sum of axisymmetric radial Gaussian rings, with the intensity profile expressed as
![Mathematical equation: $I(r) = \sum\limits_{{\rm{i}} = 1}^n {{I_{\rm{i}}}} \exp \left[ { - {{\left( {{{r - {r_{\rm{i}}}} \over {{w_{\rm{i}}}}}} \right)}^2}} \right],$](/articles/aa/full_html/2026/04/aa56059-25/aa56059-25-eq1.png) (1)
(1)
where Ii represents the peak intensity of the ith substructure, r is the radial distance from the disc centre, ri denotes the location of the substructure, and wi is the width of the Gaus-sian curve, where the substructure width is defind by the full width at half maximum (FWHM) of the profile. The corresponding model visibilities were obtained by Fourier-transforming the intensity profile using Galario (Tazzari et al. 2018). The binary discs were modelled using the sampleImage rather than the sampleProfile function in Galario in order to model both discs simultaneously.
Model fitting was performed in the visibility domain using emcee (Foreman-Mackey et al. 2013), a Markov chain Monte Carlo (MCMC) sampler that explored the optimal values of the free parameters. For each disc, the four geometric parameters – disc inclination angle (i), disc position angle (PA), and position offsets from the phase centre (∆RA and ∆Dec) – and the parameters of the Gaussian profiles were fit. To determine the number, locations and widths of the rings, we employed Frankenstein (Jennings et al. 2020), which reconstructs radial brightness profiles directly from the visibilities. The disc geometry and radial intensity profiles derived from Frankenstein were used as initial guesses for the Galario models, which were subsequently refined via MCMC.
On average, the MCMC fitting used 60 random walkers, each running for 3000 iterations. Initial parameter values were perturbed using a normal distribution scaled by a factor of 10−4 to ensure broad exploration of the parameter space. The burn-in phase typically required 2000 steps, after which the posterior distributions were sampled over the final 1000 iterations. The best-fit parameters were taken as the median values of the posterior distributions, with uncertainties estimated from the 16th-84th percentile range. Due to its complex morphology, 2MASS J11095340-7634255 could not be reliably modelled.
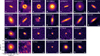 |
Fig. 1 Gallery of the 1.3 mm cleaned continuum emission images for the full sample. All images were cleaned using a Briggs weighting scheme with a robust value of +0.5, except for SSTc2d J163952.9-241931 and SSTc2d J162718.4-243915 (robust = 0.0), and SSTc2d J162823.3-242241 and 2MASS J11094742-7726290 (robust = –0.5). RA and Dec offsets from the disc centre are shown in arcseconds on the x- and y-axes, respectively. To emphasise the weak outer emission of a few discs, an asinh scaling function was applied. Each panel spans 2.0′′ × 2.0′′, with white ellipses in the lower left corner indicating the beam sizes. The colour scale represents the intensity in Jansky per beam. The final disc classifications are marked in the lower right corner: TD, RD, SD, HID, CD, and ED. For discs with names starting with SSTc2d, 2MASS, or RX, the names in the upper left corners are abbreviated to the first part after J (e.g. SSTc2d J162823.3-242241 is labelled as J162823.3). The white star in 2MASS J11095340-7634255 marks the current position of the central star. |
4.2 Modelling results
We selected the best-fit model for each disc by using the fewest parameters necessary to reproduce axisymmetric dust features with residuals below ∼3σ. Figures C.1, C.2, and C.3 compare the best-fit models with the observed visibilities and cleaned images, along with the corresponding radial brightness profiles. Figure 2 presents the best-fit radial brightness profiles for the modelled 25 discs, along with the azimuthally averaged profiles for all 26 discs, while Table 2 summarises the best-fit morphologies, effective dust disc radii, inclinations, and position angles. Substructure locations and widths are detailed in Table 3 and are highlighted in Fig. 2.
4.3 Best-fit models and residuals
Overall, the models reproduce the observations well, with minimal residuals. Some discs (e.g. SU Aur and RX J1556.1-3655) exhibit slight azimuthal asymmetries, likely caused by shadows from warps or a misaligned inner disc. Such warps can result from planetary interactions (Zhang et al. 2018) or internal instabilities (Kratter & Lodato 2016), while inner-disc misalignments can arise from tilted stellar magnetic fields (Bouvier et al. 2007). Notably, HD 139614 leaves a crescent-like residual, suggesting an unresolved azimuthal asymmetry not captured by simple radial Gaussian rings. Haro 6-37 B, MHO 1, and MHO 2 also exhibit more substantial residuals, indicating that binary discs are more difficult to model accurately and may harbour additional substructures not resolved in our current axisymmetric framework.
For SSTc2d J162546.6-242336 and SZ 133, the models fail to accurately reproduce the data due to their high inclinations (∼81° and ∼77°; see Table 2). At this angular resolution, resolving ring features in HIDs proved challenging, preventing model convergence. Consequently, their best-fit morphologies do not fully reflect their true dust distributions.
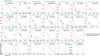 |
Fig. 2 Azimuthally averaged radial brightness profiles for all 26 discs (grey), overlaid with the best-fit model profiles (red) for the 25 modelled discs. Ring and shoulder locations in the models are marked with R and S, respectively. The corresponding physical radii in AU are indicated in green above each panel. For discs with names starting with SSTc2d, 2MASS, or RX, the names in the upper right corners are abbreviated to the first part after J (e.g. SSTc2d J162823.3-242241 is labelled as J162823.3). |
4.4 Dust disc sizes
The effective dust disc radii in Table 2 correspond to the radii encircling 68 (R68%) and 95% (R95%) of the total flux density. In most cases, our measured disc radii are smaller or larger than previously reported values, likely due to differences in angular resolution, uv-coverage, or sensitivity between observations. Higher-resolution data can resolve more compact structures and reveal substructures that alter flux distribution, while lower-resolution data may smooth out features and overestimate disc size. Variations in disc inclination, orientation, and image reconstruction techniques may also contribute to discrepancies.
For more inclined discs, the measured radius may be larger due to improved inclination constraints. Low-resolution data can misinterpret an edge-on disc as more face-on, leading to an underestimation of its size. Our high-resolution measurements provide a more accurate representation of true disc sizes by resolving inclination effects.
4.5 Disc classifications
We classified the modelled discs into five categories: transition (TD), ring (RD), shoulder (SD), compact (CD), and HIDs, as detailed below. The final disc classifications of all 26 discs can be found in column 7 of Table 1.
4.5.1 Transition discs
The TDs all exhibit central cavities with surrounding rings at varying radii. However, while the best-fit model of SU Aur suggests a cavity, the observed image does not clearly show one, though a dip in the visibility profile supports its presence. HD 139614 and SU Aur also feature shoulders, suggesting additional substructures. HD 139614 has previously been identified as a pre-transitional disc based on its spectral energy distribution (SED), which shows a mid-infrared dip indicative of a dust-depleted inner region (Labadie et al. 2014). Similarly, SU Aur’s SED has been modelled with a partially cleared inner disc, consistent with the presence of a cavity inferred from our visibility profile analysis (Akeson et al. 2002; Jeffers et al. 2014). Finally, the TD cavity 2MASS J04154278+2909597 was previously recovered with the Submillimeter Array (SMA; Espaillat et al. 2015) and recently, a misaligned transiting planet was discovered in this system, although at an orbit that is way too small to explain the cavity size (Barber et al. 2024). The misaligned architecture of the planet-disc system has been analysed in more detail in other works (Hühn et al. 2025; Shoshi et al. 2025).
4.5.2 Ring and shoulder discs
Ring discs contain one to three rings at different radii, with some also exhibiting shoulders. The shoulder discs (SDs) display smooth brightness transitions rather than distinct rings. These inflection points (Cieza et al. 2021) could result from unresolved gaps, weak pressure bumps (Zhu et al. 2012; Sturm et al. 2022), or grain size variations, potentially linked to the presence of snowlines (Cieza et al. 2016). The presence of shoulders alongside rings, gaps, and cavities in other discs suggests that they may represent an intermediate stage in disc evolution. Rather than being static structures, shoulders may arise from gradual dust accumulation at pressure maxima that are not yet deep or sharp enough to open a gap or form a high-contrast ring.
Best-fit disc morphologies and dust disc radii for all studied discs.
4.5.3 Compact discs
Compact discs in this subsection are defined as discs with an effective dust radius R68% < 30 AU that do not exhibit detectable substructures at the current angular resolution. These discs are modelled by a single Gaussian profile. Higher-resolution observations may reveal narrow substructures or substructures with low contrast.
4.5.4 Highly inclined discs
SSTc2d J162546.6-242336 and SZ 133 could not be accurately modelled due to their near edge-on orientation. Although five discs in our sample have inclinations >75° (see Table 2), three were successfully modelled, likely due to the strong contrast between their substructures and their surrounding material. The two remaining discs may contain shallow gaps or faint rings that are difficult to discern due to their nearly edge-on orientations. Despite these challenges, edge-on discs provide valuable insights into dust dynamics. Villenave et al. (2020) demonstrated that vertical dust settling and radial drift can be observed in such systems, with shorter wavelengths tracing larger disc sizes, potentially indicating dust traps. A similar analysis of our HIDs could reveal whether dust traps are present.
5 Discussion
5.1 Substructures in this sample
Of the 26 protoplanetary discs in our sample, the cleaned images and best-fit Galario models reveal a diverse range of morphologies, 17 discs exhibit substructures: six are TDs, six are RDs, and five are SDs. The remaining nine lack clear substructures at the current resolution: six have Rdust,68% < 30 AU and are classified as compact, two are highly inclined and may obscure substructures, and one (2MASS J11095340-7634255) has an unexplained dust morphology.
5.2 The radial distribution of substructures
Discs with substructures in our sample have 68% effective dust radii ranging from 23 to 98 AU and 95% radii from 42 to 150 AU. In contrast, all CDs without detected substructures have 68% radii smaller than 22 AU and 95% radii 38 AU. Apart from SSTc2d J162546.6-242336, SZ 133, and ≤2MASS J11095340-7634255, where the presence of substructures remains uncertain, every disc with 68 and 95% radii exceeding 21 and 38 AU, respectively, exhibit rings, gaps, or shoulders.
These findings align with previous ALMA disc surveys at similar resolutions (∼0.12′′). The Taurus ALMA survey (Long et al. 2018, 2019) found that discs with substructures typically have 95% dust radii between ∼40 and ~200 AU, while the DSHARP survey (Huang et al. 2018) reported substructured discs with 95% radii spanning ∼30 to ∼200 AU. This consistency suggests that large-scale substructures are commonly detected in extended dust discs when observed at sufficient angular resolution across multiple star-forming regions.
Figure 3 shows the distribution of ring and shoulder positions in our sample, which span a wide radial range from 0.2 to ∼103 AU. The widths of the substructures in our sample ∼vary from ∼10 to ∼108 AU, indicating a broad diversity in morphology. Substructures are found across nearly the full radial extent of the discs, suggesting that ring and shoulder formation can occur under a wide range of physical conditions, without a strong preference for specific radii similar as seen in previous work (e.g. Andrews et al. 2018; Long et al. 2018; van der Marel et al. 2019).
Best-fit ring and shoulder properties for discs with substructures.
5.3 2MASS J11095340-7634255
Figure 4 presents the 12CO moment 0 and moment 1 maps for 2MASS J11095340-7634255, the disc with an unexplained dust continuum morphology, observed at low angular resolution, with the bottom row offering a zoomed-in view. The moment 0 map reveals significant CO emission surrounding the star, with bright, concentrated emission in the central region of the disc. In the moment 1 map, various non-Keplerian velocity patterns suggest interactions between the disc and the surrounding gas. The zoomed-in moment 1 map highlights a velocity gradient around the marked position of the central star, where a dividing line separates redshifted and blueshifted emission, confirming Keplerian rotation within the disc.
The continuum and gas morphology both indicate that the protoplanetary disc is likely interacting with a nearby compact structure. Although no second stellar source is detected, the morphology is reminiscent of close binaries. We propose that 2MASS J11095340-7634255 could potentially be a superimposed binary system, meaning two closely projected proto-planetary discs, with the central stars nearly aligned along the line of sight, causing one to remain undetected, while the discs themselves are offset and closely interacting. Alternatively, it could be a sign of interaction with ambient material, in particular late-stage infall (Kuffmeier et al. 2023). The observed multi-wavelength variability and asymmetric gas emission (Feigelson & Lawson 2004, Rodgers-Lee et al. 2014, Sturm et al. 2022) further support the presence of ongoing dynamical processes within the system. Given these characteristics and the apparent extended, non-axisymmetric morphology, this source is provisionally classified as an ED (see Table 1). Further observations are needed to assess the presence of a companion and to clarify the system’s structure, allowing us to distinguish between these two scenarios.
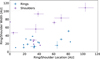 |
Fig. 3 Ring and shoulder widths as a function of their radial locations. Ring substructures are shown in blue, and shoulder substructures are shown in purple. |
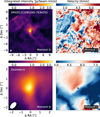 |
Fig. 4 Gallery of the high-resolution 12CO J=2-1 moment maps for 2MASS J11095340-7634255, constructed from emission exceeding the 3σ threshold. The top row shows a 20.0′′ × 20.0′′ field of view, while the bottom row provides a zoomed-in view of a 4.6′′ × 4.6′′ region around the disc. The moment 0 maps (left column) display integrated intensity in Jansky per beam kilometre per second, and the moment 1 maps (right column) show velocity in kilometre per second. Axes indicate RA and Dec offsets from the disc centre in arcseconds. The white ellipse in the moment 0 maps represents the beam size. The black star in the zoomed-in moment 1 map marks the current position of the central star. |
5.4 Complete sample of extended protoplanetary discs
With the new analysis of 26 discs at high angular resolution, it is possible to re-evaluate the question of whether all EDs contain substructures. We used the sample of van der Marel & Mulders (2021) and selected all EDs with measured 68% continuum radii of >30 AU in the main star-forming regions: Taurus, Ophiuchus, Chamaeleon, Lupus, Upper Scorpius, Upper Centaurus-Lupus, and Lower Centaurus-Crux. For Upper Sco, we extended the sample from van der Marel & Mulders (2021) to the much larger sample of Upper Sco members identified by Luhman & Esplin (2020), using ALMA data from, for example, Carpenter et al. (2025). The full Upper Sco sample and its classification is described in Appendix D. For the other regions, a number of targets with 68% disc radii >30 AU were listed in van der Marel & Mulders (2021) without further information on their substructures (labelled as compact or extended). This subset includes both the targets from this work, as well as from recent literature at higher angular resolution. These studies have revealed more information about these discs to reclassify them. The targets from the literature are listed in Table 4, including references. Target 2MASS J04192625+2826142 was removed from the sample as it turned out to be a Class III object (Rebull et al. 2010). Target 2MASS J11432669-7804454 was marked as a 4σ detection by Pascucci et al. (2016), but not recovered in ALMA archival data (programme 2023.1.01276.S) at higher sensitivity, so will be considered as a non-detection. We note that the full, combined survey now comprises 730 protoplanetary discs across all regions and classifications.
Despite these updates, two discs remain classified as ‘extended’ without further substructure categorisation: 2MASS J11095340-7634255, which has been discussed before, and AS 205 N, which is part of a binary system and exhibits prominent spiral arms but lacks rings, gaps, or cavities (Kurtovic et al. 2018).
To investigate whether all EDs contain substructures, we recreated the disc size versus dust mass diagram originally presented as Fig. 1 in van der Marel & Mulders (2021), now updated with our full ED sample and classifications (Fig. 5). The plot confirms the hypothesis from van der Marel & Mulders (2021) that at least all EDs contain large-scale substructures: for CDs this remains mostly unknown due to lack of high-resolution data, except for the Lupus star forming region (Guerra-Alvarado et al. 2025).
Interestingly, the shoulder and HIDs occupy the same region of the size-mass diagram as the RDs and TDs and are distinctly separated from the CDs. This spatial segregation suggests that these discs may indeed host substructures that are either unresolved or obscured.
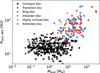 |
Fig. 5 Dust disc size as a function of dust disc mass for all detected discs in the complete sample. Transition discs are shown in red, RDs in blue, SDs in purple, HIDs in orange, EDs in green, and CDs with no detected substructures in black. Circles represent detections; upper limits are indicated by triangles. |
Updated classification on discs >30 AU from van der Marel & Mulders (2021).
5.5 Disc morphology as a function of stellar mass, dust mass, and age
To further investigate the evolutionary pathways of protoplanetary discs, we analysed the relationship between disc morphology, stellar mass, dust mass, and age, following the hypothesis of van der Marel & Mulders (2021), using the newly found substructures as well as the updated sample of discs in Upper Sco (Appendix D).
Figure 6 presents the dust mass-substructure relation in histograms, separated into two age groups: young (1–5 Myr) and old (∼10 Myr). Here, each class is colour-coded: transition (red), ring (blue), shoulder (purple), highly inclined (orange), extended (green), and CDs with no detected substructures (black), with grey representing upper limits. Structured discs are concentrated at higher dust masses (∼1–200 M⊕), while CDs cluster at lower values (∼0.01–30 M⊕), with a noticeable decrease in dust mass in the older group. This supports the hypothesis of two distinct evolutionary tracks for the updated sample. Structured discs are thought to maintain higher dust masses due to the presence of pressure bumps that halt radial drift and trap millimetre-sized grains (e.g. Pinilla et al. 2012; Zhang et al. 2018; Dullemond et al. 2018). Compact discs, in contrast, likely evolve without such traps and undergo rapid dust depletion, consistent with grain growth and drift models (e.g. Birnstiel et al. 2010). Based on the findings in Pinilla et al. (2025), the decrease in dust mass seen in the CDs may be due to leaky dust traps rather than full radial drift. It has also been suggested that CDs may have been born small rather than a lack of strong dust traps (Miotello et al. 2021), but due to the lack of deep 12CO observations and the difficulty in their interpretation as gas disc size tracer (Trapman et al. 2019) it has been challenging to confirm or reject this scenario.
To further explore the occurrence of different morphologies over time, we analysed the relative fraction of disc types in young and old regions using pie charts (Fig. 7). In young regions, CDs with no detected substructures dominate the sample (76 7%), with RDs and TDs being the most common structured types but without significant difference in their relative occurrence (error bar computed assuming Poisson statistics). The SDs, HIDs, and EDs together make up only 3%. In older regions, the fraction of CDs with no detected substructures is 81±12%, so statistically indifferent from the young regions. The difference between RD and TD fractions is statistically insignificant assuming Poisson errors.
To assess the dependence of disc morphology on stellar mass independent of disc dust mass or age, following the same hypothesis as before, we examined the distribution of structural types across stellar mass bins (Fig. 8). This figure updates the original Fig. 6 from van der Marel & Mulders (2021), presenting pie charts that show the relative fractions of TDs, RDs, SDs, HIDs, EDs, and CDs with no detected substructures for each stellar mass category.
The results reproduce the previously reported correlation between stellar mass and disc structure. Structured discs are significantly more prevalent around higher-mass stars. Transition discs, in particular, show a strong dependence on stellar mass: they account for only 2% of the discs in the very low-mass bin (0.1–0.5 M⊙), increase to ∼18% in the intermediate-mass range (0.5–1.5 M⊙), and peak at 48% for stars above 1.5 M⊙. Ring discs exhibit a similar trend, rising from 6% in the lowest mass bin to 21% in the intermediate and high-mass bins.
Interestingly, while TDs dominate among high-mass stars, RDs slightly outnumber them in the subsolar mass regime. Compact discs with no detected substructures remain the dominant morphology across most bins, but decrease in frequency with increasing stellar mass, from 89% in the very low-mass bin, to only 24% in the highest. These findings suggest that higher-mass stars are more likely to host structured discs, particularly transition and ring types, possibly due to more favourable conditions for substructure formation such as larger and more massive discs (e.g. Andrews et al. 2018; van der Marel et al. 2018). Whereas this hypothesis does depend on the assumption that large-scale substructures are only detectable in larger discs (Bae et al. 2023), the results by Guerra-Alvarado et al. (2025) do exclude large-scale substructures at wide (>30 AU) orbital radii for CDs in Lupus, consistent with their compact dust sizes.
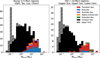 |
Fig. 6 Distribution of dust disc masses, separated by age group. Structured discs are shown in red (transition), blue (ring), purple (shoulder), orange (highly inclined), and green (extended). Compact discs with no detected substructures are marked in black, and upper limits are indicated in grey. For clarity, the histograms are stacked in the vertical direction and do not overlap at y = 0. |
 |
Fig. 7 Distribution of disc morphologies across the two age groups. Disc types are colour-coded: red (transition), blue (ring), purple (shoulder), orange (highly inclined), green (extended), and black (compact, no substructures). The pie charts display the percentage of each morphology within the respective age group in white. The total number of discs in each age bin is indicated in brackets above each chart. |
5.6 Compact discs
Within the large sample, 445 discs are classified as compact (68% radii <30 AU) and appear smooth, lacking detectable substructures at current resolutions. This is consistent with earlier studies that did not detect substructures in CDs in pro-toplanetary disc surveys at typical angular resolutions (e.g. Long et al. 2019; Kurtovic et al. 2021; van der Marel et al. 2022; Miley et al. 2024; Shi et al. 2024). While most CDs appear featureless, recent high-resolution observations have revealed substructures in a minority of them, including cavities and faint rings down to scales of ∼4 AU (Guerra-Alvarado et al. 2025) This suggests that some substructures may remain undetected due to limited resolution or contrast, especially in the inner disc regions (Long et al. 2019).
Compact discs are thought to evolve through leaky dust traps or radial drift (van der Marel & Mulders 2021; Pinilla et al. 2025), considering their decrease in millimetre-flux (dust mass) while retaining their typical dust disc size. Their location on the size-luminosity relation aligns with a drift-dominated evolution scenario (Guerra-Alvarado et al. 2025), though deviations may arise due to disc truncation in binaries or the presence of unresolved dust traps. Studies analysing the gas-to-dust disc size ratio generally argue against radial drift as common feature (e.g. Toci et al. 2021), but these studies do not include the fainter discs, biasing their sample. Compact discs may already have converted much of their solids into planetesimals or planets, making them promising analogues for the formation of compact planetary systems, including Super-Earths. As resolution improves, previously smooth discs increasingly show signs of substructure, suggesting that even higher-resolution observations may reveal hidden features in CDs.
5.7 Whether all extended discs contain substructures
Among the 125 EDs in our sample (R68% > 30 AU), 114 exhibit resolved substructures such as rings, gaps, cavities, or shoulders. The remaining 11 include 9 highly inclined systems, where detection is limited by projection effects, and 2 ambiguous cases: 2MASS J11095340-7634255 (likely a superimposed binary), and AS 205 N (part of a binary system with spiral-like emission but no clear rings or gaps). This yields a raw detection rate of 91% (114/125), representing the fraction of EDs in the sample where substructures are observed. However, excluding the 9 HIDs, where substructures may be present but are not detectable due to projection effects, the detection rate among discs where substructures can be reliably identified rises to 98% (114/116).
Extended, apparently smooth discs are∼ also rare in other regions. MP Mus (R68% = 30 AU), originally classified as smooth by Ribas et al. (2023), was recently found to host additional gaps and an inner cavity based on new high-resolution observations at longer wavelengths (Aguayo et al. 2025; Ribas et al. 2025).
Taken together, these results suggest that substructures are a near-universal feature of EDs. The few exceptions may be due to observational limitations, such as inclination, or to physical effects like binarity and dynamical truncation. The ubiquity of substructures has important implications for dust evolution: pressure maxima associated with rings and gaps can trap particles, slow radial drift, and promote grain growth (Pinilla et al. 2012). Such dust traps may also serve as favourable sites for planetesimal and ultimately planet formation, potentially resolving the radial drift and fragmentation barriers in planet formation theory (e.g. Birnstiel et al. 2012; Carrera et al. 2015). The early emergence and widespread occurrence of substructures therefore appear to play a central role in shaping the initial conditions for planet formation.
 |
Fig. 8 Distribution of disc morphologies across different stellar mass bins. Disc types are colour-coded: red (transition), blue (ring), purple (shoulder), orange (highly inclined), green (extended), and black (compact). The pie charts display the percentage of each morphology within each stellar mass bin in white. The total number of discs in each bin is indicated in brackets above each chart. |
6 Conclusion
We present high-resolution ALMA Band 6 (1.33 mm) observations at ∼0.12” resolution of 26 protoplanetary discs, primarily focusing on EDs with 68% dust radii larger than 30 AU. These observations complete the known sample of nearby discs in the main star-forming regions and aim to address the question of whether all EDs contain substructures. We compared the full disc sample and its classifications with stellar age and mass. The key findings of this work are:
Of the 26 analysed discs, 17 show substructures: six are TDs, six are RDs, and five are SDs.
Nine discs lack clear substructures: six are compact (R68% < 30 AU), two are highly inclined, and one (2MASS J11095340-7634255) shows an irregular morphology possibly due to a superimposed binary or late-stage infall.
Discs with substructures have 68% effective dust radii between 23 and 98 AU.
We detected 12CO J=2-1 emission in 15 discs. In all cases, the gas discs are larger than the dust discs, consistent with the higher opacity of 12CO rotational emission compared to millimetre continuum emission. Whether this is also a sign of radial drift requires a more detailed analysis (Trapman et al. 2020).
Extended CO structures are observed in four discs, including the known tail in SU Aur, suggesting ongoing accretion or late infall; additional tails in other discs may relate to outflows or remnant envelope material.
Building on the hypothesis of van der Marel & Mulders (2021), we analysed a large sample of discs by dividing it into structured discs and smooth CDs with R68% < 30 AU. We reproduced the previous findings that the latter category decreases in dust mass, whereas structured discs do not, with an updated sample (Fig. 6). With the same classification, we reproduced a previous result on the stellar mass dependence of structured discs, whereby structured discs appear to be more common around higher-mass stars. Transition discs show a strong stellar mass dependence, increasing in occurrence from 2% in the 0.1–0.5 M⊙ range to 48% for stars above 1.5 M⊙.
Nearly all (∼91%) EDs (R68% > 30 AU) contain substructures; when accounting for highly inclined systems where substructures may be undetectable, the fraction may be as high as ~98%.
The prevalence of substructures in EDs and their correlation with stellar mass imply that the origin of substructures could have a stellar mass dependence as well. This is consistent with the proposed hypothesis of van der Marel & Mulders (2021) that substructures are dust traps caused by giant planets at wide orbital radii, as exoplanets show a similar stellar mass dependence.
Data availability
Full Table D.1 is available at the CDS via https://cdsarc.cds.unistra.fr/viz-bin/cat/J/A+A/708/A143.
Acknowledgements
This paper makes use of the following ALMA data: ADS/JAO.ALMA#2022.1.01302.S. ALMA is a partnership of ESO (representing its member states), NSF (USA) and NINS (Japan), together with NRC (Canada), NSTC and ASIAA (Taiwan), and KASI (Republic of Korea), in cooperation with the Republic of Chile. The Joint ALMA Observatory is operated by ESO, AUI/NRAO and NAOJ. G.D.M. acknowledges support from FONDECYT project 1252141 and the ANID BASAL project FB210003. The PI acknowledges assistance from Allegro, the European ALMA Regional Center node in the Netherlands. We thank Melissa McClure for useful discussions.
References
- Aguayo, A., Caceres, C., Guo, Z., et al. 2025, A&A, 698, A165 [NASA ADS] [CrossRef] [EDP Sciences] [Google Scholar]
- Akeson, R. L., Ciardi, D. R., van Belle, G. T., & Creech-Eakman, M. J. 2002, ApJ, 566, 1124 [Google Scholar]
- Akeson, R. L., Jensen, E. L. N., Carpenter, J., et al. 2019, ApJ, 872, 158 [Google Scholar]
- Akiyama, E., Vorobyov, E. I., Liu, H. B., et al. 2019, AJ, 157, 165 [NASA ADS] [CrossRef] [Google Scholar]
- Alcalá, J. M., Manara, C. F., Natta, A., et al. 2017, A&A, 600, A20 [NASA ADS] [CrossRef] [EDP Sciences] [Google Scholar]
- Andrews, S. M., Huang, J., Pérez, L. M., et al. 2018, ApJ, 869, L41 [NASA ADS] [CrossRef] [Google Scholar]
- Ansdell, M., Williams, J. P., van der Marel, N., et al. 2016, ApJ, 828, 46 [Google Scholar]
- Ansdell, M., Williams, J. P., Trapman, L., et al. 2018, ApJ, 859, 21 [NASA ADS] [CrossRef] [Google Scholar]
- Ansdell, M., Haworth, T. J., Williams, J. P., et al. 2020, AJ, 160, 248 [Google Scholar]
- Bae, J., Isella, A., Zhu, Z., et al. 2023, ASP Conf. Ser., 534, 423 [NASA ADS] [Google Scholar]
- Banzatti, A., Pascucci, I., Bosman, A. D., et al. 2020, ApJ, 903, 124 [NASA ADS] [CrossRef] [Google Scholar]
- Banzatti, A., Pontoppidan, K. M., Carr, J. S., et al. 2023, ApJ, 957, L22 [NASA ADS] [CrossRef] [Google Scholar]
- Barber, M. G., Mann, A. W., Vanderburg, A., et al. 2024, Nature, 635, 574 [NASA ADS] [CrossRef] [Google Scholar]
- Barenfeld, S. A., Carpenter, J. M., Ricci, L., & Isella, A. 2016, ApJ, 827, 142 [Google Scholar]
- Baruteau, C., Crida, A., Paardekooper, S. J., et al. 2014, in Protostars and Planets VI, eds. H. Beuther, R. S. Klessen, C. P. Dullemond, & T. Henning (Tucson: University of Arizona Press), 667 [Google Scholar]
- Bertout, C., & Genova, F. 2006, A&A, 460, 499 [NASA ADS] [CrossRef] [EDP Sciences] [Google Scholar]
- Birnstiel, T. 2024, ARA&A, 62, 157 [Google Scholar]
- Birnstiel, T., Ricci, L., Trotta, F., et al. 2010, A&A, 516, L14 [NASA ADS] [CrossRef] [EDP Sciences] [Google Scholar]
- Birnstiel, T., Klahr, H., & Ercolano, B. 2012, A&A, 539, A148 [NASA ADS] [CrossRef] [EDP Sciences] [Google Scholar]
- Boogert, A. C. A., Hogerheijde, M. R., Ceccarelli, C., et al. 2002, ApJ, 570, 708 [NASA ADS] [CrossRef] [Google Scholar]
- Bouvier, J., Alencar, S. H. P., Boutelier, T., et al. 2007, A&A, 463, 1017 [NASA ADS] [CrossRef] [EDP Sciences] [Google Scholar]
- Carpenter, J. M., Esplin, T. L., Luhman, K. L., Mamajek, E. E., & Andrews, S. M. 2025, ApJ, 978, 117 [Google Scholar]
- Carrera, D., Johansen, A., & Davies, M. B. 2015, A&A, 579, A43 [NASA ADS] [CrossRef] [EDP Sciences] [Google Scholar]
- Chakraborty, A., & Ge, J. 2004, AJ, 127, 2898 [NASA ADS] [CrossRef] [Google Scholar]
- Cieza, L. A., Casassus, S., Tobin, J., et al. 2016, Nature, 535, 258 [Google Scholar]
- Cieza, L. A., Ruíz-Rodríguez, D., Hales, A., et al. 2019, MNRAS, 482, 698 [Google Scholar]
- Cieza, L. A., González-Ruilova, C., Hales, A. S., et al. 2021, MNRAS, 501, 2934 [Google Scholar]
- de Leon, J., Takami, M., Karr, J. L., et al. 2015, ApJ, 806, L10 [Google Scholar]
- Dullemond, C. P., Birnstiel, T., Huang, J., et al. 2018, ApJ, 869, L46 [NASA ADS] [CrossRef] [Google Scholar]
- Dutrey, A., Guilloteau, S., Prato, L., et al. 1998, A&A, 338, L63 [NASA ADS] [Google Scholar]
- Espaillat, C., Andrews, S., Powell, D., et al. 2015, ApJ, 807, 156 [Google Scholar]
- Facchini, S., Birnstiel, T., Bruderer, S., & van Dishoeck, E. F. 2017, A&A, 605, A16 [NASA ADS] [CrossRef] [EDP Sciences] [Google Scholar]
- Feigelson, E. D., & Lawson, W. A. 2004, ApJ, 614, 267 [Google Scholar]
- Flock, M., Ruge, J. P., Dzyurkevich, N., et al. 2015, A&A, 574, A68 [NASA ADS] [CrossRef] [EDP Sciences] [Google Scholar]
- Foreman-Mackey, D., Hogg, D. W., Lang, D., & Goodman, J. 2013, PASP, 125, 306 [Google Scholar]
- Gaia Collaboration (Brown, A. G. A., et al.) 2021, A&A, 649, A1 [NASA ADS] [CrossRef] [EDP Sciences] [Google Scholar]
- Gasman, D., van Dishoeck, E. F., Grant, S. L., et al. 2023, A&A, 679, A117 [NASA ADS] [CrossRef] [EDP Sciences] [Google Scholar]
- Gasman, D., Temmink, M., van Dishoeck, E. F., et al. 2025, A&A, 694, A147 [NASA ADS] [CrossRef] [EDP Sciences] [Google Scholar]
- Ginski, C., Facchini, S., Huang, J., et al. 2021, ApJ, 908, L25 [NASA ADS] [CrossRef] [Google Scholar]
- Grady, C. A., Woodgate, B., Gull, T., et al. 2001, AAS Meeting Abstracts, 198, 77.16 [Google Scholar]
- Guerra-Alvarado, O. M., van der Marel, N., Williams, J. P., et al. 2025, A&A, 696, A232 [NASA ADS] [CrossRef] [EDP Sciences] [Google Scholar]
- Guilloteau, S., & Dutrey, A. 1998, A&A, 339, 467 [Google Scholar]
- Hawley, J. F. 2001, ApJ, 554, 534 [Google Scholar]
- Huang, J., Andrews, S. M., Dullemond, C. P., et al. 2018, ApJ, 869, L42 [NASA ADS] [CrossRef] [Google Scholar]
- Hühn, L.-A., Jiang, H.-C., & Dullemond, C. P. 2025, A&A, 701, L15 [NASA ADS] [CrossRef] [EDP Sciences] [Google Scholar]
- Jeffers, S. V., Min, M., Canovas, H., Rodenhuis, M., & Keller, C. U. 2014, A&A, 561, A23 [NASA ADS] [CrossRef] [EDP Sciences] [Google Scholar]
- Jennings, J., Booth, R. A., Tazzari, M., Rosotti, G. P., & Clarke, C. J. 2020, MNRAS, 495, 3209 [Google Scholar]
- Johnson, J. A., Aller, K. M., Howard, A. W., & Crepp, J. R. 2010, PASP, 122, 905 [Google Scholar]
- Kratter, K., & Lodato, G. 2016, ARA&A, 54, 271 [Google Scholar]
- Krijt, S., Banzatti, A., Zhang, K., et al. 2025, ApJ, 990, L72 [Google Scholar]
- Kuffmeier, M., Jensen, S. S., & Haugbølle, T. 2023, EPJ Plus, 138, 272 [NASA ADS] [Google Scholar]
- Kurtovic, N. T., Pérez, L. M., Benisty, M., et al. 2018, ApJ, 869, L44 [Google Scholar]
- Kurtovic, N. T., Pinilla, P., Long, F., et al. 2021, A&A, 645, A139 [EDP Sciences] [Google Scholar]
- Labadie, L., Matter, A., Kreplin, A., et al. 2014, SPIE Conf. Ser., 9146, 91462T [Google Scholar]
- Long, F., Herczeg, G. J., Harsono, D., et al. 2019, ApJ, 882, 49 [Google Scholar]
- Long, F., Pinilla, P., Herczeg, G. J., et al. 2018, ApJ, 869, 17 [Google Scholar]
- Luhman, K. L., & Esplin, T. L. 2020, AJ, 160, 44 [Google Scholar]
- Luhman, K. L., Herrmann, K. A., Mamajek, E. E., Esplin, T. L., & Pecaut, M. J. 2018, AJ, 156, 76 [Google Scholar]
- Manara, C. F., Prusti, T., Comeron, F., et al. 2018, A&A, 615, L1 [NASA ADS] [CrossRef] [EDP Sciences] [Google Scholar]
- Manara, C. F., Natta, A., Rosotti, G. P., et al. 2020, A&A, 639, A58 [NASA ADS] [CrossRef] [EDP Sciences] [Google Scholar]
- Miley, J. M., Carpenter, J., Booth, R., et al. 2024, A&A, 682, A55 [NASA ADS] [CrossRef] [EDP Sciences] [Google Scholar]
- Miotello, A., Rosotti, G., Ansdell, M., et al. 2021, A&A, 651, A48 [NASA ADS] [CrossRef] [EDP Sciences] [Google Scholar]
- Natta, A., Testi, L., Neri, R., Shepherd, D. S., & Wilner, D. J. 2004, A&A, 416, 179 [NASA ADS] [CrossRef] [EDP Sciences] [Google Scholar]
- Pascucci, I., Testi, L., Herczeg, G. J., et al. 2016, ApJ, 831, 125 [Google Scholar]
- Pinilla, P., Birnstiel, T., Ricci, L., et al. 2012, A&A, 538, A114 [NASA ADS] [CrossRef] [EDP Sciences] [Google Scholar]
- Pinilla, P., Pascucci, I., & Marino, S. 2020, A&A, 635, A105 [NASA ADS] [CrossRef] [EDP Sciences] [Google Scholar]
- Pinilla, P., Sierra, A., Kurtovic, N. T., et al. 2025, MNRAS, 543, 2723 [Google Scholar]
- Rebull, L. M., Padgett, D. L., McCabe, C. E., et al. 2010, ApJS, 186, 259 [NASA ADS] [CrossRef] [Google Scholar]
- Ribas, Á., Macías, E., Weber, P., et al. 2023, A&A, 673, A77 [NASA ADS] [CrossRef] [EDP Sciences] [Google Scholar]
- Ribas, Á., Vioque, M., Zagaria, F., et al. 2025, Nat. Astron., 9, 1176 [Google Scholar]
- Rodgers-Lee, D., Scholz, A., Natta, A., & Ray, T. 2014, MNRAS, 443, 1587 [CrossRef] [Google Scholar]
- Sacco, G. G., Flaccomio, E., Pascucci, I., et al. 2012, ApJ, 747, 142 [NASA ADS] [CrossRef] [Google Scholar]
- Shi, Y., Long, F., Herczeg, G. J., et al. 2024, ApJ, 966, 59 [Google Scholar]
- Shoshi, A., Muto, T., Bosschaart, Q., et al. 2025, ApJ, 993, 90 [Google Scholar]
- Stapper, L. M., Hogerheijde, M. R., van Dishoeck, E. F., & Mentel, R. 2022, A&A, 658, A112 [NASA ADS] [CrossRef] [EDP Sciences] [Google Scholar]
- Sturm, J. A., McClure, M. K., Harsono, D., et al. 2022, A&A, 660, A126 [NASA ADS] [CrossRef] [EDP Sciences] [Google Scholar]
- Tazzari, M., Beaujean, F., & Testi, L. 2018, MNRAS, 476, 4527 [Google Scholar]
- Teague, R., & Foreman-Mackey, D. 2018, RNAAS, 2, 173 [NASA ADS] [Google Scholar]
- Testi, L., Natta, A., Shepherd, D. S., & Wilner, D. J. 2003, A&A, 403, 323 [NASA ADS] [CrossRef] [EDP Sciences] [Google Scholar]
- Toci, C., Rosotti, G., Lodato, G., Testi, L., & Trapman, L. 2021, MNRAS, 507, 818 [NASA ADS] [CrossRef] [Google Scholar]
- Tofflemire, B. M., Prato, L., Kraus, A. L., et al. 2024, AJ, 167, 232 [Google Scholar]
- Trapman, L., Facchini, S., Hogerheijde, M. R., van Dishoeck, E. F., & Bruderer, S. 2019, A&A, 629, A79 [NASA ADS] [CrossRef] [EDP Sciences] [Google Scholar]
- Trapman, L., Ansdell, M., Hogerheijde, M. R., et al. 2020, A&A, 638, A38 [NASA ADS] [CrossRef] [EDP Sciences] [Google Scholar]
- Tripathi, A., Andrews, S. M., Birnstiel, T., & Wilner, D. J. 2017, ApJ, 845, 44 [Google Scholar]
- van der Marel, N. 2023, EPJ Plus, 138, 225 [NASA ADS] [Google Scholar]
- van der Marel, N., & Mulders, G. D. 2021, AJ, 162, 28 [NASA ADS] [CrossRef] [Google Scholar]
- van der Marel, N., Williams, J. P., Ansdell, M., et al. 2018, ApJ, 854, 177 [Google Scholar]
- van der Marel, N., Dong, R., di Francesco, J., Williams, J. P., & Tobin, J. 2019, ApJ, 872, 112 [Google Scholar]
- van der Marel, N., Williams, J. P., Picogna, G., et al. 2022, ArXiv e-prints [arXiv:2204.08225] [Google Scholar]
- Villenave, M., Ménard, F., Dent, W. R. F., et al. 2020, A&A, 642, A164 [EDP Sciences] [Google Scholar]
- Villenave, M., Stapelfeldt, K. R., Duchêne, G., et al. 2022, ApJ, 930, 11 [NASA ADS] [CrossRef] [Google Scholar]
- Vioque, M., Oudmaijer, R. D., Baines, D., Mendigutía, I., & Pérez-Martínez, R. 2018, A&A, 620, A128 [NASA ADS] [CrossRef] [EDP Sciences] [Google Scholar]
- Weidenschilling, S. J. 1977, MNRAS, 180, 57 [Google Scholar]
- Yamaguchi, M., Muto, T., Tsukagoshi, T., et al. 2024, PASJ, 76, 437 [Google Scholar]
- Zhang, K., Blake, G. A., & Bergin, E. A. 2015, ApJ, 806, L7 [Google Scholar]
- Zhang, S., Zhu, Z., Huang, J., et al. 2018, ApJ, 869, L47 [Google Scholar]
- Zhu, Z., Nelson, R. P., Dong, R., Espaillat, C., & Hartmann, L. 2012, ApJ, 755, 6 [Google Scholar]
Appendix A Sample and observational details
This appendix provides supplementary information on the target sample and the ALMA observations used in this study. Table A.1 summarises the stellar properties, dust disc radii, and estimated dust disc masses of the 26 protoplanetary discs, taken from literature. Table A.2 lists the key observational parameters for the 23 star systems, including beam sizes, integration times, weather conditions, and calibrators.
Appendix B 12CO gas results
We detected 12CO J=2-1 line emission in 15 discs: 2MASS J11095340-7634255, 2MASS J11094742-7726290, 2MASS J11104959-7717517, 2MASS J11111083-7641574, HD 139614, SZ 133, SSTc2d J163952.9-241931, SSTc2d J162652.0-243039, SSTc2d J162823.3-242241, SSTc2d J162718.4-243915, SU Aur, SSTc2d J162546.6-242336, SSTc2d J162145.1-234232, and the binary system MHO 1 and MHO 2. For the first seven discs, low-resolution data was available and used to create moment maps, while for the remaining eight discs, only high-resolution data was used. We first discuss the results from the low-resolution maps, followed by the high-resolution maps. The binary system is addressed separately, as the gas inside of these discs may dynamically influence one another. Additionally, we discuss 2MASS J11095340-7634255 individually due to its unique dust emission morphology.
Appendix B.1 Low-resolution 12CO moment maps
Figure B.1 presents the 12CO moment 0 and moment 1 maps for the six discs observed at low angular resolution. The moment 0 maps reveal no discernible substructures, with the CO gas emission generally aligning with the dust continuum emission. However, the gas discs consistently extend beyond their corresponding dust discs. This size disparity is attributed to the higher optical depth of CO gas compared to dust, allowing gas to remain detectable at greater distances (e.g. Dutrey et al. 1998; Guilloteau & Dutrey 1998; Facchini et al. 2017), as well as radial drift concentrating dust grains in the inner disc regions (e.g. Testi et al. 2003; Natta et al. 2004; Birnstiel et al. 2010).
Foreground absorption, likely originating from nearby cold molecular clouds, is observed in the channel maps of nearly all discs. This absorption, particularly pronounced in 2MASS J11094742-7726290, introduces asymmetries in the moment maps. Such foreground absorption is common in star-forming regions like Ophiuchus, where molecular clouds with low temperatures and narrow intrinsic line widths shield CO disc emission in specific velocity ranges (e.g. Boogert et al. 2002).
The moment 1 maps show distinct redshifted (red) and blueshifted (blue) regions on opposite sides of each discs, characteristic of Keplerian rotation. Similarly to other ALMA disc observations (e.g. Ansdell et al. 2018), the gas discs are larger than their dust counterparts.
The host star properties and estimated dust disc sizes and dust disc masses of the 26 protoplanetary discs taken from literature.
Observational details of the 23 targets.
Appendix B.2 High-resolution 12CO moment maps
Figure B.2 displays the 12CO moment 0 and moment 1 maps for the six single discs observed at high angular resolution. These maps show increased noise, evident as background speckling, compared to the low-resolution maps in Fig. B.1. This heightened noise results from the finer spatial details captured and instrumental factors, such as thermal and electronic noise associated with high-resolution observations.
As in the low-resolution maps, no discernible substructures are visible in the moment 0 maps, and the gas disc orientation generally align with the dust continuum. Foreground absorption again introduces asymmetries, particularly in SSTc2d J162823.3-242241. The moment 1 maps show clear Keplerian rotation in five discs, indicating smooth elliptical orbits of gas particles governed by the central star’s gravity. In contrast, 12CO gas in SSTc2d J162652.0-243039 is only faintly visible in a few channel maps, suggesting that foreground molecular clouds heavily obscured its emission, resulting in a weak and non-Keplerian signal.
Three discs, SU Aur, SSTc2d J162546.6-242336, and SSTc2d J162145.1-234232, exhibit extended CO emission beyond their protoplanetary discs. For SU Aur, the extended emission appears as a tail originating from the disc centre and extending to the right. Similar structures have been observed in optical, near-infrared scattered light, and CO studies (Grady et al. 2001; Chakraborty & Ge 2004; Bertout & Genova 2006; Jeffers et al. 2014; de Leon et al. 2015; Akiyama et al. 2019; Ginski et al. 2021), suggesting active accretion and a phase of late infall, potentially impacting the disc’s evolution.
SSTc2d J162546.6-242336 displays excess CO emission both below and to the upper right of the disc, possibly representing remnant material from star formation or outflows from the central star. Further research is needed to clarify its origin.
In SSTc2d J162145.1-234232, two large CO gas tails are visible, likely influenced by protostellar outflows. Sacco et al. (2012) detected Ne II emission in this disc, attributing it to shock ionisation from outflows. A similar process could enhance CO emission, as shocks compress and heat the surrounding molecular gas. This may explain the extended structures seen in our observations, though further studies are needed to confirm this interpretation.
Appendix B.3 High-resolution 12CO moment maps for MHO 1+2
Figure B.3 shows the 12CO moment 0 and moment 1 maps for the binary system MHO 1+2 observed at high angular resolution. In the upper disc, MHO 1, the CO emission is uniformly distributed, aligning with the dust disc, but lacks a velocity gradient or evidence of Keplerian rotation. In contrast, the lower disc, MHO 2, exhibits a clear velocity gradient in the moment 1 map, indicative of Keplerian rotation. Notably, the gas disc in MHO 2 shows no cavity corresponding to the structure seen in its dust disc, indicating that the gas cavity may be too small to be resolved.
The absence of Keplerian rotation in MHO 1 may result from gravitational interactions with MHO 2, where tidal forces and perturbations disrupt the expected motion (see Tofflemire et al. 2024). Additionally, no extended gas emission is observed in the moment maps, suggesting the absence of a circumbinary disc in this system.
Appendix C Best-fit models
This appendix presents the results of the Galario visibility modelling for the 25 discs. For each single disc, we show the deprojected visibilities, cleaned image, best-fit model image, residuals, and radial brightness profile. The models reproduce the observed axisymmetric features with residuals below ~3σ, using the minimal number of Gaussian components required. For the three binary systems, the results for both components are shown within the same figure: the visibilities represent the combined system, while the radial brightness profiles display separate curves for each disc. Discs are grouped by morphological classification: transition, ring, shoulder, compact, and highly inclined. Figures C.1, C.2, and C.3 provide the model comparisons for each class.
Appendix D Upper Sco
The Upper Sco targets in the sample of van der Marel & Mulders (2021) was largely based on the first ALMA survey of this region by Barenfeld et al. (2016) with the addition of a handful of early type stars, resulting in a total of 72 Class II discs. However, Luhman et al. (2018) identified hundreds of new members in Upper Sco, later refined in Luhman & Esplin (2020) with Gaia DR2 data. Carpenter et al. (2025) presented a new ALMA Band 7 survey of Upper Sco based on the newly identified members at moderate resolution ranging from 0.1 to 0.3", and constrained disc sizes with visibility modelling for the detected discs. Based on these studies, we redefined the Upper Sco sample from van der Marel & Mulders (2021) with all protoplanetary discs, i.e. all members classified as either ‘full’ or ‘transitional’ discs by Luhman & Esplin (2020), resulting in a total of 205 targets. The majority of these targets were included in Carpenter et al. (2025), so fluxes and estimates on disc sizes are readily available. For a subset of 10 of the brightest targets, high-resolution ALMA data at 0.03" resolution were taken in programme 2022.1.00646.S (PI Feng Long). For the 24 targets that were not included in Carpenter et al. (2025), published ALMA Band 6 or 7 data were available for 10 targets, as well as ALMA archival data for seven targets. For seven targets, no ALMA data are available, which is less than 4% of the total sample. We note that some of the newly identified Upper Sco members were previously considered as members of Ophiuchus, and included in ALMA Ophiuchus surveys.
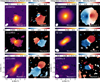 |
Fig. B.1 Gallery of the low-resolution 12CO J=2-1 moment maps for 2MASS J11094742-7726290, 2MASS J11104959-7717517, 2MASS J11111083-7641574 (left panels, top to bottom), HD 139614, SZ 133, and SSTc2d J163952.9-241931 (right panels, top to bottom), constructed from emission exceeding the 3σ threshold. Moment 0 maps (left columns) display integrated intensity in Jansky per beam kilometre per second, and moment 1 maps (right columns) show velocity in kilometre per second. Axes indicate RA and Dec offsets from the disc centre in arcseconds. Each panel spans 4.6" × 4.6", with white ellipses in moment 0 maps representing beam sizes. For discs with names starting with SSTc2d or 2MASS, the names in the upper left corners of the moment 0 maps are abbreviated to the first part after J (e.g. 2MASS J11094742-7726290 is labelled as J11094742). |
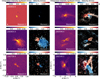 |
Fig. B.2 Gallery of the low-resolution 12CO J=2-1 moment maps for SSTc2d J162652.0-243039, SSTc2d J162823.3-242241, SSTc2d J162718.4-243915 (left panels, top to bottom), SU Aur, SSTc2d J162546.6-242336, and SSTc2d J162145.1-234232 (right panels, top to bottom), constructed from emission exceeding the 3σ threshold. Moment 0 maps (left columns) display integrated intensity in Jansky per beam kilometre per second, and moment 1 maps (right columns) show velocity in kilometre per second. Axes indicate RA and Dec offsets from the disc centre in arcseconds. The left panels span 3.6" × 3.6", while the right panels span 8.0" × 8.0". White ellipses in moment 0 maps representing beam sizes. For discs with names starting with SSTc2d or 2MASS, the names in the upper left corners of the moment 0 maps are abbreviated to the first part after J (e.g. SSTc2d J162652.0-243039 is labelled as J162652.0). |
New Upper Sco sample.
Using the ALMA data described above, we classified all discs based on visual inspection as TDs (15), RDs (4), HID (2), non-structured (129), non-detection (45), and unknown (10), similar to the approach in van der Marel & Mulders (2021). The unknown category includes the seven discs without ALMA data as well as three discs with only very low resolution ALMA data of > 0.5" (HD 144432, HD 145718 and PDS 415). We note that these three are all Group II Herbig discs which are generally very compact in millimetre emission (Stapper et al. 2022).
For the non-structured discs, we used the estimated 68% dust disc radii to classify the discs as either compact (< 30 AU) or extended (> 30 AU): only six discs are considered extended with radii between 31 and 39 AU, without further information on their substructure. Further inspection of these six targets shows that they all have small millimetre-fluxes of < 5 mJy and that the uncertainties on their derived sizes are relatively large: therefore, we classified them as compact as well.
The full disc sample of Upper Sco is presented in Table D.1, including their millimetre-flux, disc radius, classification, and stellar information. The latter is taken from Barenfeld et al. (2016); Manara et al. (2020); Luhman & Esplin (2020) and references within. As Luhman & Esplin (2020) did not derive stellar masses, they were estimated from the spectral type based on the stellar masses of other Upper Sco members with the same spectral type.
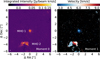 |
Fig. B.3 High-resolution 12CO J=2-1 moment maps for MHO 1+2, constructed from emission exceeding the 3σ threshold. The moment 0 map (left) displays integrated intensity in Jansky per beam kilometre per second, and the moment 1 map (right) shows velocity in kilometre per second. Axes indicate RA and Dec offsets from the disc centre in arcseconds. Both panels span 12.6" × 12.6", with a white ellipse in the moment 0 map representing the beam size. |
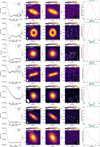 |
Fig. C.1 Comparison of data and best-fit model for the first seven modelled single discs. Column 1 shows deprojected and binned visibilities (observations in black, models in red) as a function of uv-distance. Columns 2 and 3 display the cleaned data and model images, convolved with the same beam. For discs with names starting with SSTc2d, 2MASS, or RX, the names in the upper left corners of column 2 are abbreviated to the first part after J (e.g. SSTc2d J162823.3-242241 is labelled as J162823.3). Column 4 presents residual images with ±3σ contours in white. RA and Dec offsets are in arcseconds, and the colour scale represents intensity in Jansky per beam. Beam sizes are indicated in the lower left. Column 5 shows the radial brightness profiles with AU conversions in green above each profile. |
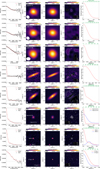 |
Fig. C.3 Same as for Fig. C.1 but for the last five modelled single discs and the three modelled binary discs. |
All Tables
The host star properties and estimated dust disc sizes and dust disc masses of the 26 protoplanetary discs taken from literature.
All Figures
|
Fig. 1 Gallery of the 1.3 mm cleaned continuum emission images for the full sample. All images were cleaned using a Briggs weighting scheme with a robust value of +0.5, except for SSTc2d J163952.9-241931 and SSTc2d J162718.4-243915 (robust = 0.0), and SSTc2d J162823.3-242241 and 2MASS J11094742-7726290 (robust = –0.5). RA and Dec offsets from the disc centre are shown in arcseconds on the x- and y-axes, respectively. To emphasise the weak outer emission of a few discs, an asinh scaling function was applied. Each panel spans 2.0′′ × 2.0′′, with white ellipses in the lower left corner indicating the beam sizes. The colour scale represents the intensity in Jansky per beam. The final disc classifications are marked in the lower right corner: TD, RD, SD, HID, CD, and ED. For discs with names starting with SSTc2d, 2MASS, or RX, the names in the upper left corners are abbreviated to the first part after J (e.g. SSTc2d J162823.3-242241 is labelled as J162823.3). The white star in 2MASS J11095340-7634255 marks the current position of the central star. |
| In the text | |
|
Fig. 2 Azimuthally averaged radial brightness profiles for all 26 discs (grey), overlaid with the best-fit model profiles (red) for the 25 modelled discs. Ring and shoulder locations in the models are marked with R and S, respectively. The corresponding physical radii in AU are indicated in green above each panel. For discs with names starting with SSTc2d, 2MASS, or RX, the names in the upper right corners are abbreviated to the first part after J (e.g. SSTc2d J162823.3-242241 is labelled as J162823.3). |
| In the text | |
|
Fig. 3 Ring and shoulder widths as a function of their radial locations. Ring substructures are shown in blue, and shoulder substructures are shown in purple. |
| In the text | |
|
Fig. 4 Gallery of the high-resolution 12CO J=2-1 moment maps for 2MASS J11095340-7634255, constructed from emission exceeding the 3σ threshold. The top row shows a 20.0′′ × 20.0′′ field of view, while the bottom row provides a zoomed-in view of a 4.6′′ × 4.6′′ region around the disc. The moment 0 maps (left column) display integrated intensity in Jansky per beam kilometre per second, and the moment 1 maps (right column) show velocity in kilometre per second. Axes indicate RA and Dec offsets from the disc centre in arcseconds. The white ellipse in the moment 0 maps represents the beam size. The black star in the zoomed-in moment 1 map marks the current position of the central star. |
| In the text | |
|
Fig. 5 Dust disc size as a function of dust disc mass for all detected discs in the complete sample. Transition discs are shown in red, RDs in blue, SDs in purple, HIDs in orange, EDs in green, and CDs with no detected substructures in black. Circles represent detections; upper limits are indicated by triangles. |
| In the text | |
|
Fig. 6 Distribution of dust disc masses, separated by age group. Structured discs are shown in red (transition), blue (ring), purple (shoulder), orange (highly inclined), and green (extended). Compact discs with no detected substructures are marked in black, and upper limits are indicated in grey. For clarity, the histograms are stacked in the vertical direction and do not overlap at y = 0. |
| In the text | |
|
Fig. 7 Distribution of disc morphologies across the two age groups. Disc types are colour-coded: red (transition), blue (ring), purple (shoulder), orange (highly inclined), green (extended), and black (compact, no substructures). The pie charts display the percentage of each morphology within the respective age group in white. The total number of discs in each age bin is indicated in brackets above each chart. |
| In the text | |
|
Fig. 8 Distribution of disc morphologies across different stellar mass bins. Disc types are colour-coded: red (transition), blue (ring), purple (shoulder), orange (highly inclined), green (extended), and black (compact). The pie charts display the percentage of each morphology within each stellar mass bin in white. The total number of discs in each bin is indicated in brackets above each chart. |
| In the text | |
|
Fig. B.1 Gallery of the low-resolution 12CO J=2-1 moment maps for 2MASS J11094742-7726290, 2MASS J11104959-7717517, 2MASS J11111083-7641574 (left panels, top to bottom), HD 139614, SZ 133, and SSTc2d J163952.9-241931 (right panels, top to bottom), constructed from emission exceeding the 3σ threshold. Moment 0 maps (left columns) display integrated intensity in Jansky per beam kilometre per second, and moment 1 maps (right columns) show velocity in kilometre per second. Axes indicate RA and Dec offsets from the disc centre in arcseconds. Each panel spans 4.6" × 4.6", with white ellipses in moment 0 maps representing beam sizes. For discs with names starting with SSTc2d or 2MASS, the names in the upper left corners of the moment 0 maps are abbreviated to the first part after J (e.g. 2MASS J11094742-7726290 is labelled as J11094742). |
| In the text | |
|
Fig. B.2 Gallery of the low-resolution 12CO J=2-1 moment maps for SSTc2d J162652.0-243039, SSTc2d J162823.3-242241, SSTc2d J162718.4-243915 (left panels, top to bottom), SU Aur, SSTc2d J162546.6-242336, and SSTc2d J162145.1-234232 (right panels, top to bottom), constructed from emission exceeding the 3σ threshold. Moment 0 maps (left columns) display integrated intensity in Jansky per beam kilometre per second, and moment 1 maps (right columns) show velocity in kilometre per second. Axes indicate RA and Dec offsets from the disc centre in arcseconds. The left panels span 3.6" × 3.6", while the right panels span 8.0" × 8.0". White ellipses in moment 0 maps representing beam sizes. For discs with names starting with SSTc2d or 2MASS, the names in the upper left corners of the moment 0 maps are abbreviated to the first part after J (e.g. SSTc2d J162652.0-243039 is labelled as J162652.0). |
| In the text | |
|
Fig. B.3 High-resolution 12CO J=2-1 moment maps for MHO 1+2, constructed from emission exceeding the 3σ threshold. The moment 0 map (left) displays integrated intensity in Jansky per beam kilometre per second, and the moment 1 map (right) shows velocity in kilometre per second. Axes indicate RA and Dec offsets from the disc centre in arcseconds. Both panels span 12.6" × 12.6", with a white ellipse in the moment 0 map representing the beam size. |
| In the text | |
|
Fig. C.1 Comparison of data and best-fit model for the first seven modelled single discs. Column 1 shows deprojected and binned visibilities (observations in black, models in red) as a function of uv-distance. Columns 2 and 3 display the cleaned data and model images, convolved with the same beam. For discs with names starting with SSTc2d, 2MASS, or RX, the names in the upper left corners of column 2 are abbreviated to the first part after J (e.g. SSTc2d J162823.3-242241 is labelled as J162823.3). Column 4 presents residual images with ±3σ contours in white. RA and Dec offsets are in arcseconds, and the colour scale represents intensity in Jansky per beam. Beam sizes are indicated in the lower left. Column 5 shows the radial brightness profiles with AU conversions in green above each profile. |
| In the text | |
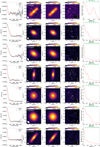 |
Fig. C.2 Same as for Fig. C.1 but for the next seven modelled single discs. |
| In the text | |
|
Fig. C.3 Same as for Fig. C.1 but for the last five modelled single discs and the three modelled binary discs. |
| In the text | |
Current usage metrics show cumulative count of Article Views (full-text article views including HTML views, PDF and ePub downloads, according to the available data) and Abstracts Views on Vision4Press platform.
Data correspond to usage on the plateform after 2015. The current usage metrics is available 48-96 hours after online publication and is updated daily on week days.
Initial download of the metrics may take a while.