Fig. B.2
Download original image
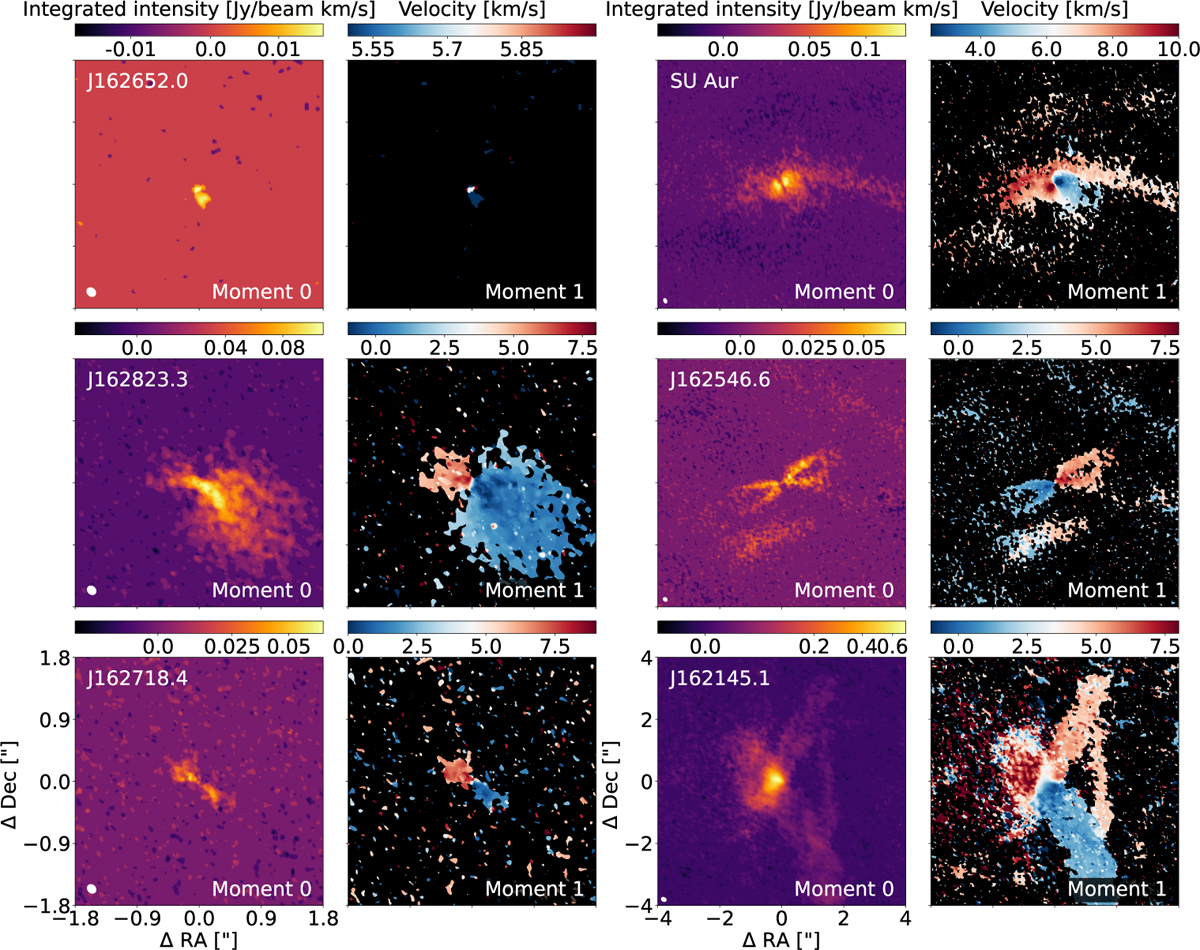
Gallery of the low-resolution 12CO J=2-1 moment maps for SSTc2d J162652.0-243039, SSTc2d J162823.3-242241, SSTc2d J162718.4-243915 (left panels, top to bottom), SU Aur, SSTc2d J162546.6-242336, and SSTc2d J162145.1-234232 (right panels, top to bottom), constructed from emission exceeding the 3σ threshold. Moment 0 maps (left columns) display integrated intensity in Jansky per beam kilometre per second, and moment 1 maps (right columns) show velocity in kilometre per second. Axes indicate RA and Dec offsets from the disc centre in arcseconds. The left panels span 3.6" × 3.6", while the right panels span 8.0" × 8.0". White ellipses in moment 0 maps representing beam sizes. For discs with names starting with SSTc2d or 2MASS, the names in the upper left corners of the moment 0 maps are abbreviated to the first part after J (e.g. SSTc2d J162652.0-243039 is labelled as J162652.0).
Current usage metrics show cumulative count of Article Views (full-text article views including HTML views, PDF and ePub downloads, according to the available data) and Abstracts Views on Vision4Press platform.
Data correspond to usage on the plateform after 2015. The current usage metrics is available 48-96 hours after online publication and is updated daily on week days.
Initial download of the metrics may take a while.