Fig. C.1
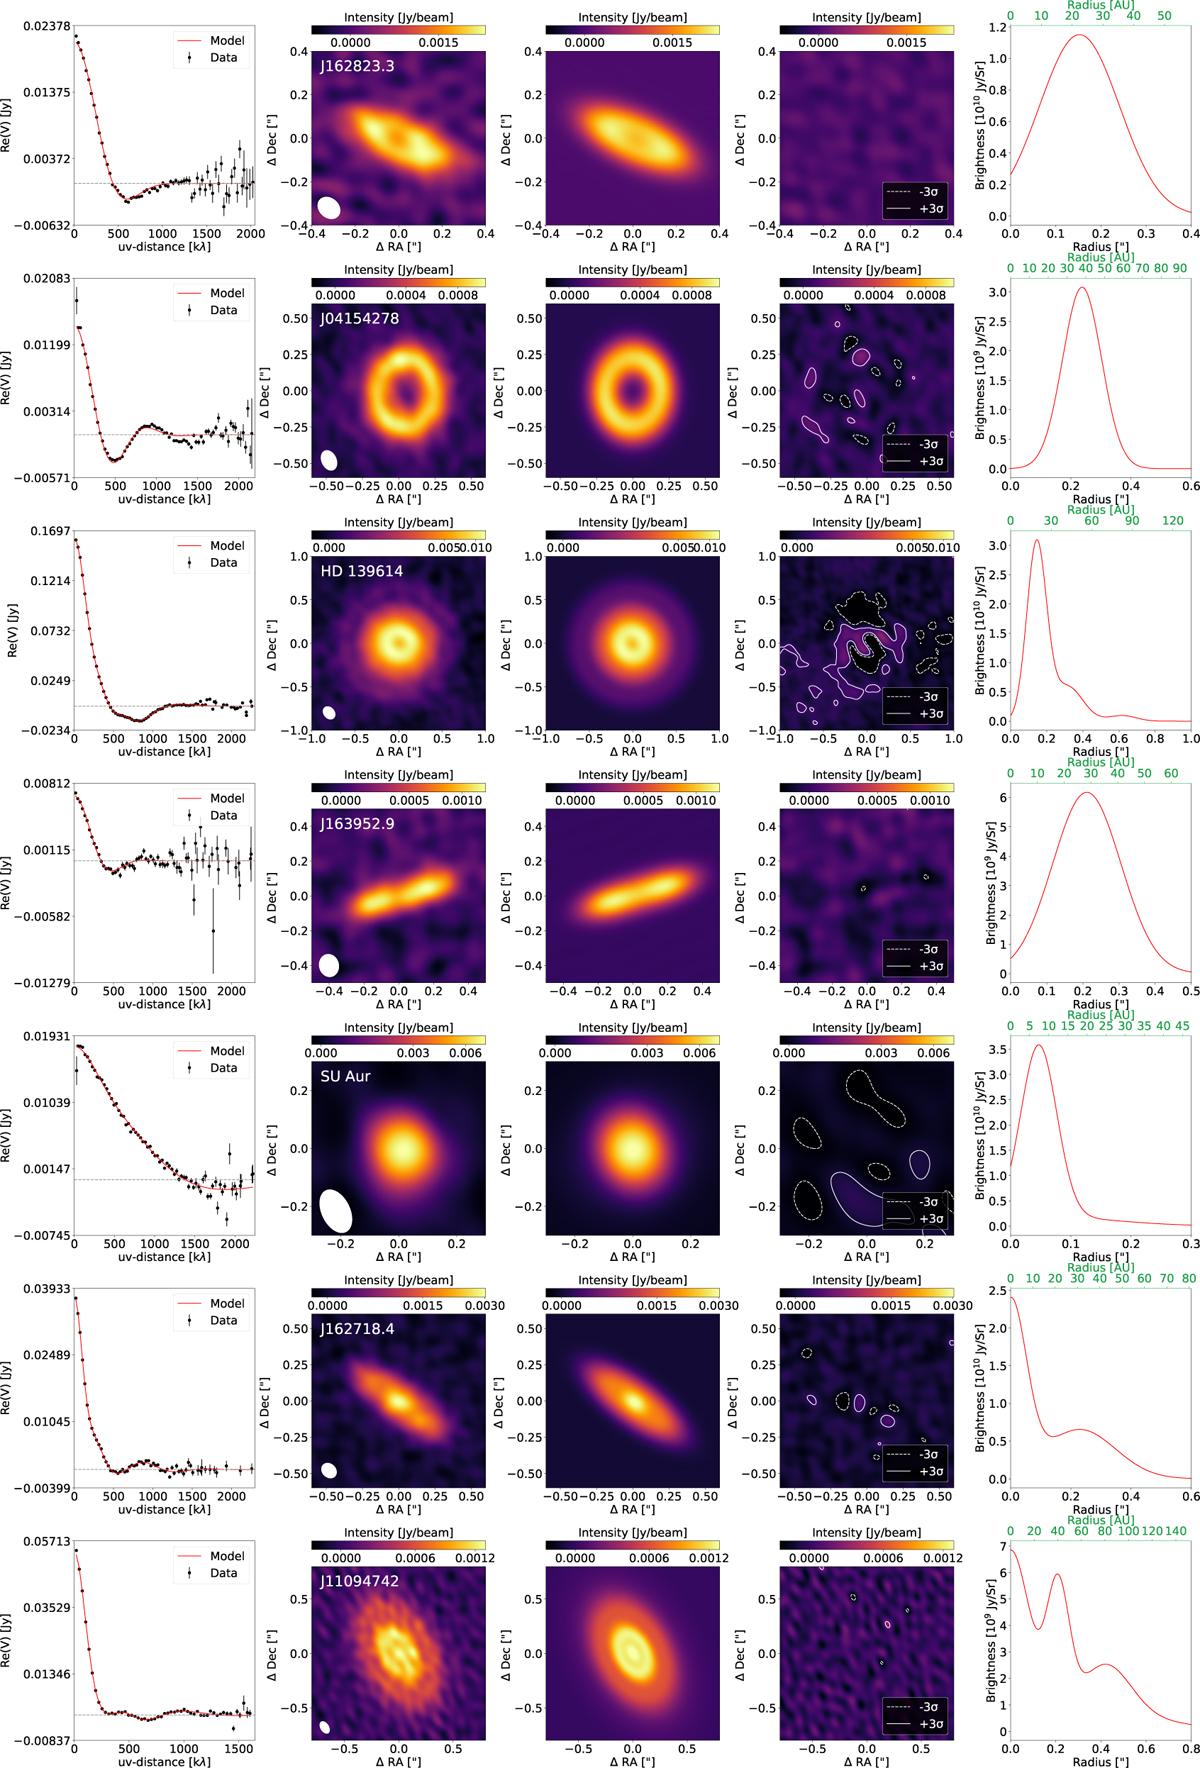
Download original image
Comparison of data and best-fit model for the first seven modelled single discs. Column 1 shows deprojected and binned visibilities (observations in black, models in red) as a function of uv-distance. Columns 2 and 3 display the cleaned data and model images, convolved with the same beam. For discs with names starting with SSTc2d, 2MASS, or RX, the names in the upper left corners of column 2 are abbreviated to the first part after J (e.g. SSTc2d J162823.3-242241 is labelled as J162823.3). Column 4 presents residual images with ±3σ contours in white. RA and Dec offsets are in arcseconds, and the colour scale represents intensity in Jansky per beam. Beam sizes are indicated in the lower left. Column 5 shows the radial brightness profiles with AU conversions in green above each profile.
Current usage metrics show cumulative count of Article Views (full-text article views including HTML views, PDF and ePub downloads, according to the available data) and Abstracts Views on Vision4Press platform.
Data correspond to usage on the plateform after 2015. The current usage metrics is available 48-96 hours after online publication and is updated daily on week days.
Initial download of the metrics may take a while.