Fig. 6
Download original image
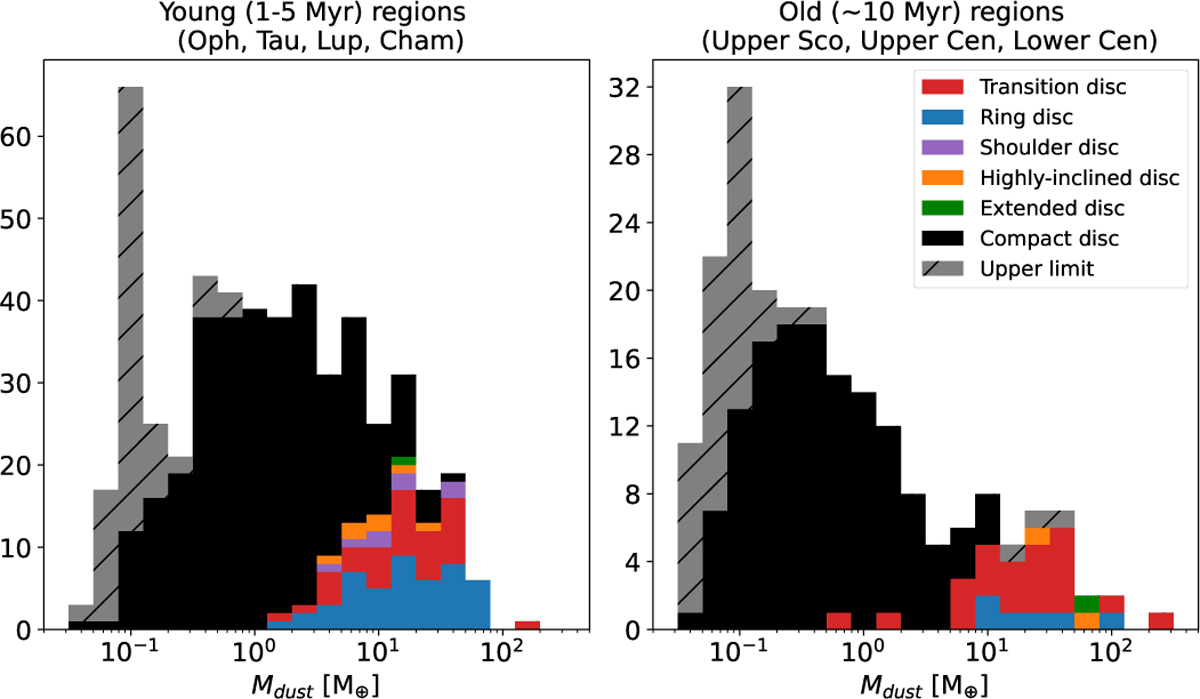
Distribution of dust disc masses, separated by age group. Structured discs are shown in red (transition), blue (ring), purple (shoulder), orange (highly inclined), and green (extended). Compact discs with no detected substructures are marked in black, and upper limits are indicated in grey. For clarity, the histograms are stacked in the vertical direction and do not overlap at y = 0.
Current usage metrics show cumulative count of Article Views (full-text article views including HTML views, PDF and ePub downloads, according to the available data) and Abstracts Views on Vision4Press platform.
Data correspond to usage on the plateform after 2015. The current usage metrics is available 48-96 hours after online publication and is updated daily on week days.
Initial download of the metrics may take a while.