Fig. 8
Download original image
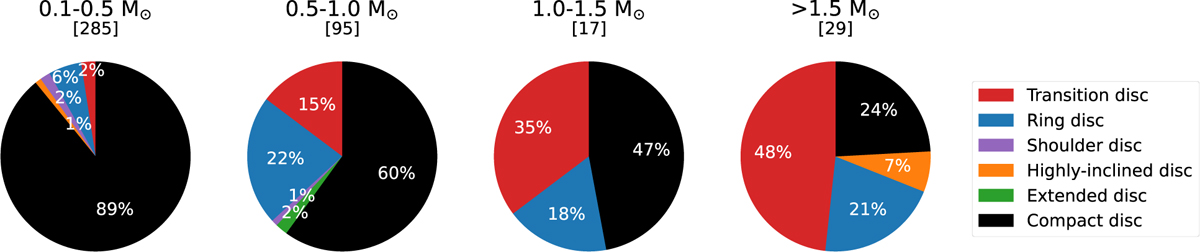
Distribution of disc morphologies across different stellar mass bins. Disc types are colour-coded: red (transition), blue (ring), purple (shoulder), orange (highly inclined), green (extended), and black (compact). The pie charts display the percentage of each morphology within each stellar mass bin in white. The total number of discs in each bin is indicated in brackets above each chart.
Current usage metrics show cumulative count of Article Views (full-text article views including HTML views, PDF and ePub downloads, according to the available data) and Abstracts Views on Vision4Press platform.
Data correspond to usage on the plateform after 2015. The current usage metrics is available 48-96 hours after online publication and is updated daily on week days.
Initial download of the metrics may take a while.