Fig. 14.
Download original image
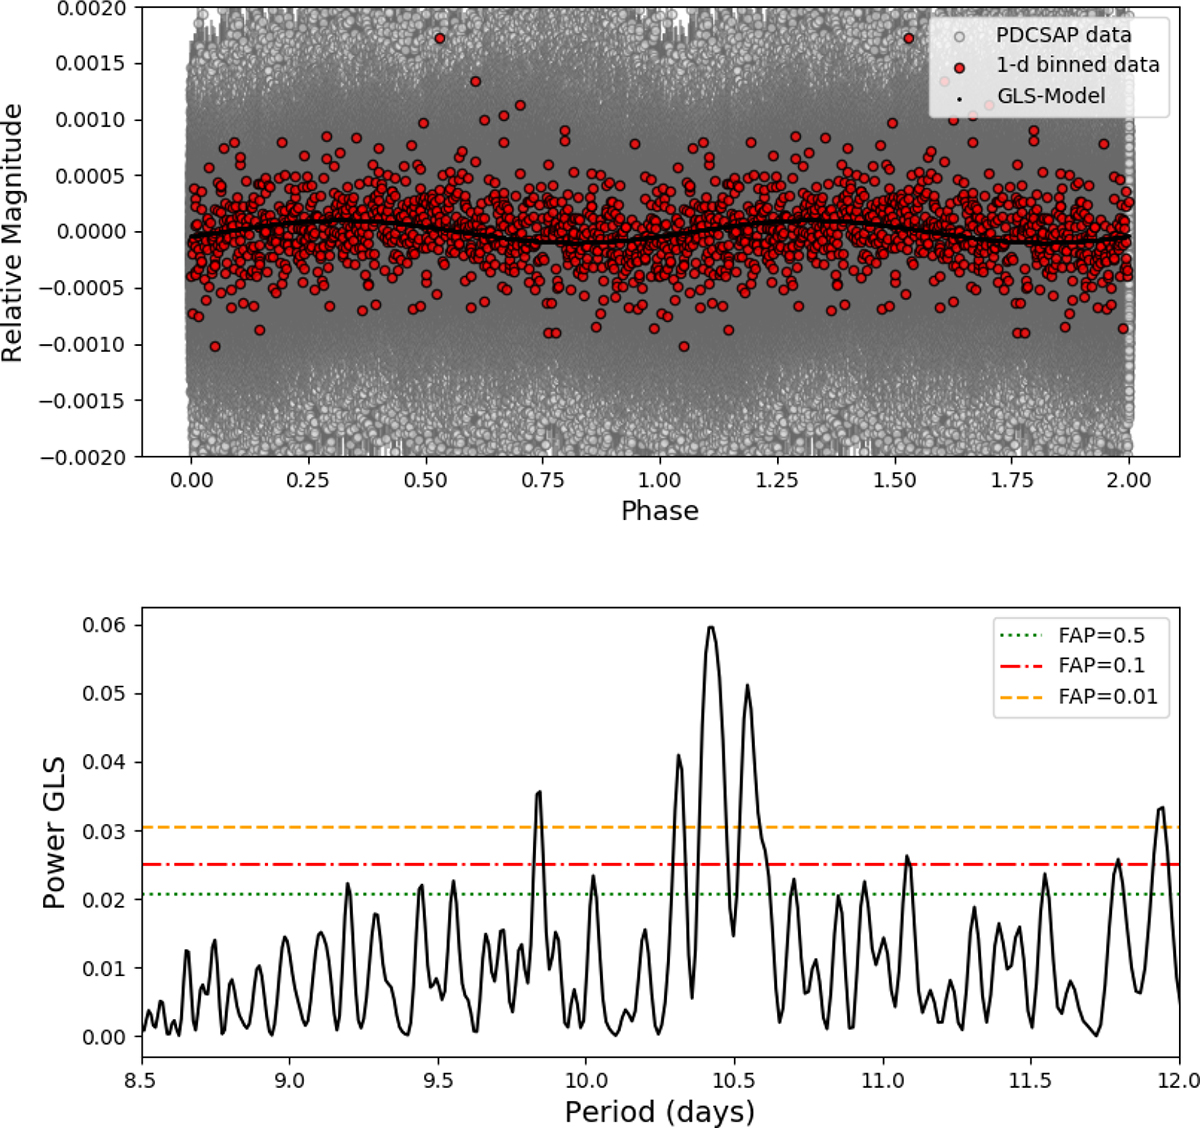
TESS photometric rotation signature of GJ 617A. Top panel: Zoom-in view of the phase-folded 2-min cadence TESS light curve of GJ 617A considering a period of 10.4 days. Grey and red symbols indicate the 2-min cadence and 1-day binned TESS data, respectively. The solid line represents the best sinusoidal fit to the data. Bottom panel: GLS periodogram of the 1-day binned 2-min cadence TESS light curve. Horizontal lines indicate different FAP values.
Current usage metrics show cumulative count of Article Views (full-text article views including HTML views, PDF and ePub downloads, according to the available data) and Abstracts Views on Vision4Press platform.
Data correspond to usage on the plateform after 2015. The current usage metrics is available 48-96 hours after online publication and is updated daily on week days.
Initial download of the metrics may take a while.