Fig. 16.
Download original image
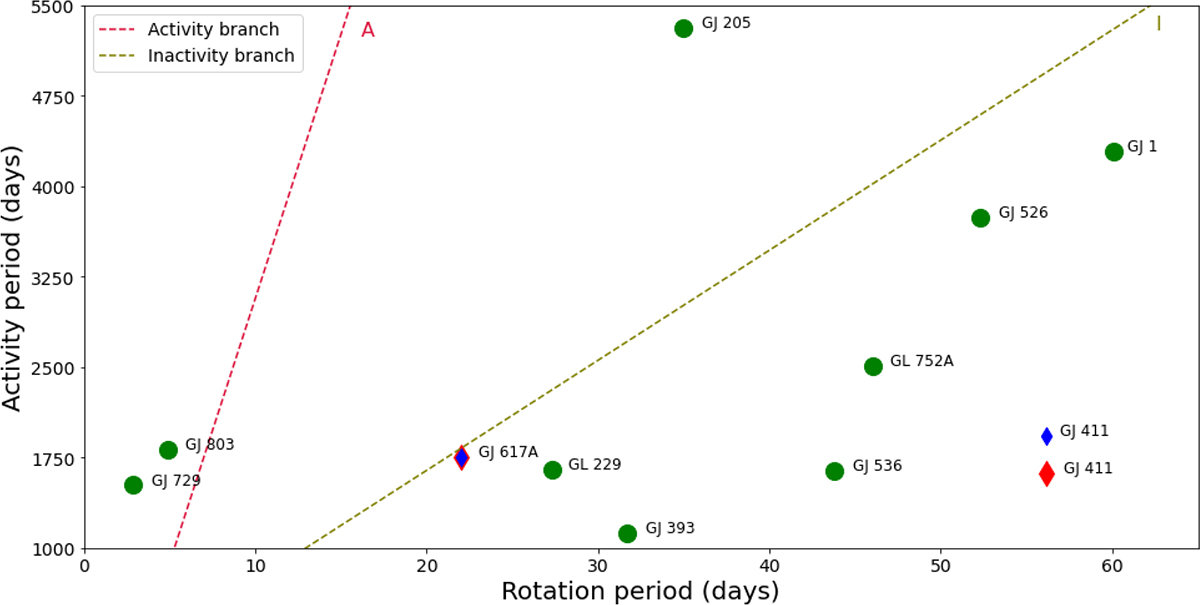
Activity period (days) versus rotation period (days). The dashed red lines represent the active branch (A), while the dashed olive lines represent the inactive branch (I). These lines were taken from the work of Metcalfe et al. (2016) and were computed for solar-type stars. The green dots correspond to some M-type stars. Blue diamonds represent the results obtained in this work based on the S-index, and red diamonds correspond to results obtained based on the Hα index.
Current usage metrics show cumulative count of Article Views (full-text article views including HTML views, PDF and ePub downloads, according to the available data) and Abstracts Views on Vision4Press platform.
Data correspond to usage on the plateform after 2015. The current usage metrics is available 48-96 hours after online publication and is updated daily on week days.
Initial download of the metrics may take a while.