Open Access
Fig. 7.
Download original image
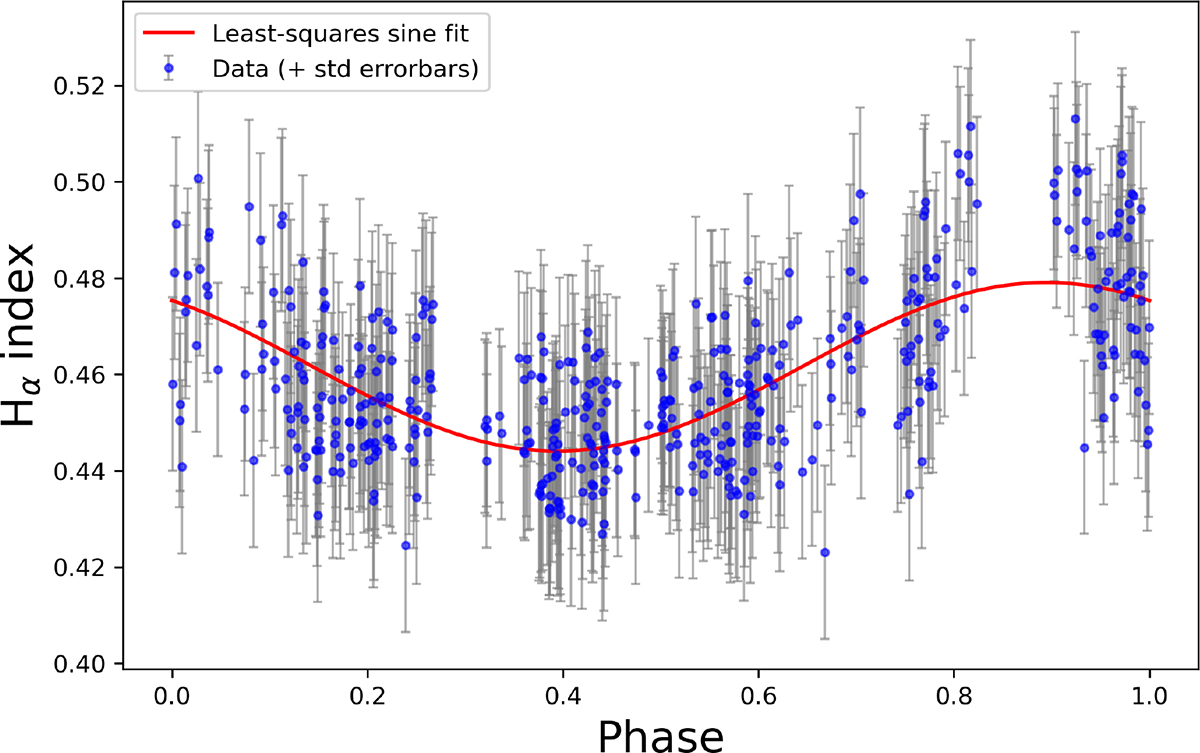
Variability on GJ 617A. The phase-folded time series Hα activity index versus the phase of the datasets is indicated with blue circles. The harmonic curve that best fits the data is in red. The phase folding was performed using the period obtained from the GLS analysis.
Current usage metrics show cumulative count of Article Views (full-text article views including HTML views, PDF and ePub downloads, according to the available data) and Abstracts Views on Vision4Press platform.
Data correspond to usage on the plateform after 2015. The current usage metrics is available 48-96 hours after online publication and is updated daily on week days.
Initial download of the metrics may take a while.